
Compare Confidence Petro with Similar Stocks
Dashboard
Strong ability to service debt as the company has a low Debt to EBITDA ratio of 2.20 times
Healthy long term growth as Net Sales has grown by an annual rate of 40.38%
The company has declared Positive results for the last 5 consecutive quarters
With ROCE of 9, it has a Attractive valuation with a 1.5 Enterprise value to Capital Employed
Market Beating Performance
Total Returns (Price + Dividend) 
Latest dividend: 0.09978673491149499 per share ex-dividend date: Sep-23-2025
Risk Adjusted Returns v/s
Returns Beta

News
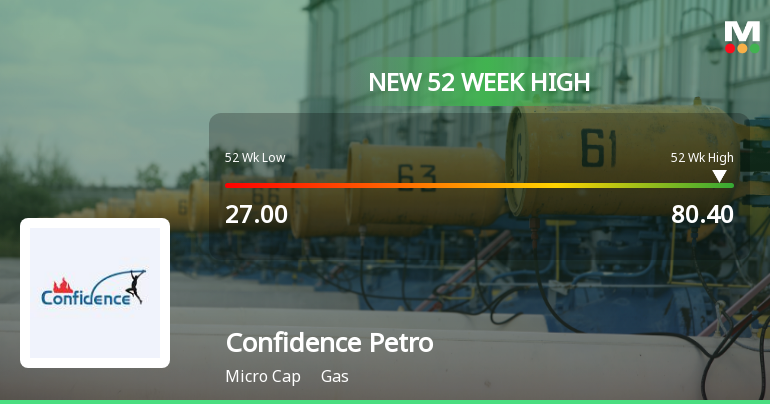
Broad-Based Technical Strength Lifts Confidence Petroleum India Ltd to 52-Week High of Rs 80.4
Surging past its previous peak, Confidence Petroleum India Ltd touched a fresh 52-week high of Rs 80.4 on 2 Jul 2026, marking a remarkable 51.29% gain over the past year and significantly outperforming the Sensex, which declined by 7.39% during the same period.
Read full news article
Confidence Petroleum India Ltd is Rated Buy
Confidence Petroleum India Ltd is rated Buy by MarketsMOJO, with this rating last updated on 03 June 2026. However, the analysis and financial metrics discussed here reflect the stock’s current position as of 26 June 2026, providing investors with the most up-to-date view of the company’s fundamentals, returns, and market performance.
Read full news article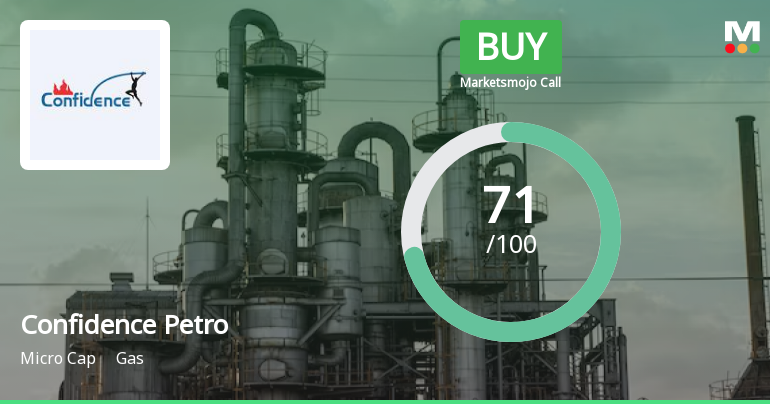
Confidence Petroleum India Ltd is Rated Buy
Confidence Petroleum India Ltd is rated 'Buy' by MarketsMOJO, with this rating last updated on 03 June 2026. However, the analysis and financial metrics discussed here reflect the company’s current position as of 15 June 2026, providing investors with the latest insights into its performance and outlook.
Read full news article Announcements
Closure of Trading Window
30-Jun-2026 | Source : BSEattaching herewith intimation of closure of trading window
Announcement under Regulation 30 (LODR)-Investor Presentation
23-Jun-2026 | Source : BSEAttaching herewith investor presentation
Announcement under Regulation 30 (LODR)-Analyst / Investor Meet - Intimation
20-Jun-2026 | Source : BSEAttaching herewith intimation of Analyst/ investor meet
Corporate Actions

No Upcoming Board Meetings

Confidence Petroleum India Ltd has declared 10% dividend, ex-date: 23 Sep 25

No Splits history available

No Bonus history available

No Rights history available
Quality key factors
Valuation key factors
Technicals key factors
 Technical Indicator Scale: Bearish, Mildly Bearish, Sideways, Mildly Bullish, Bullish Turned
 Shareholding Snapshot : Mar 2026
Shareholding Compare (%holding)
Promoters
3.595
Held by 1 Schemes (0.0%)
Held by 27 FIIs (0.48%)
Gaspoint Petroleum India Limited (21.33%)
Bw Lpg Infrastructure Dmcc (8.5%)
29.23%
Quarterly Results Snapshot (Consolidated) - Mar'26 - QoQ

QoQ Growth in quarter ended Mar 2026 is -12.78% vs 41.80% in Dec 2025

QoQ Growth in quarter ended Mar 2026 is 48.93% vs 3.54% in Dec 2025
Half Yearly Results Snapshot (Consolidated) - Sep'25
Growth in half year ended Sep 2025 is 37.50% vs 0.66% in Sep 2024
Growth in half year ended Sep 2025 is 11.54% vs -43.59% in Sep 2024
Nine Monthly Results Snapshot (Consolidated) - Dec'25
YoY Growth in nine months ended Dec 2025 is 57.09% vs 7.40% in Dec 2024
YoY Growth in nine months ended Dec 2025 is -8.11% vs -27.32% in Dec 2024
Annual Results Snapshot (Consolidated) - Mar'26
YoY Growth in year ended Mar 2026 is 49.55% vs 16.58% in Mar 2025
YoY Growth in year ended Mar 2026 is 7.72% vs -14.94% in Mar 2025
About Confidence Petroleum India Ltd

Company Coordinates


