
Compare Narayana Hrudaya with Similar Stocks
Dashboard
High Management Efficiency with a high ROCE of 24.32%
Strong ability to service debt as the company has a low Debt to EBITDA ratio of 3.62 times
Healthy long term growth as Net Sales has grown by an annual rate of 25.05% and Operating profit at 282.56%
With ROCE of 14.9, it has a Attractive valuation with a 5.4 Enterprise value to Capital Employed
Majority shareholders : Promoters
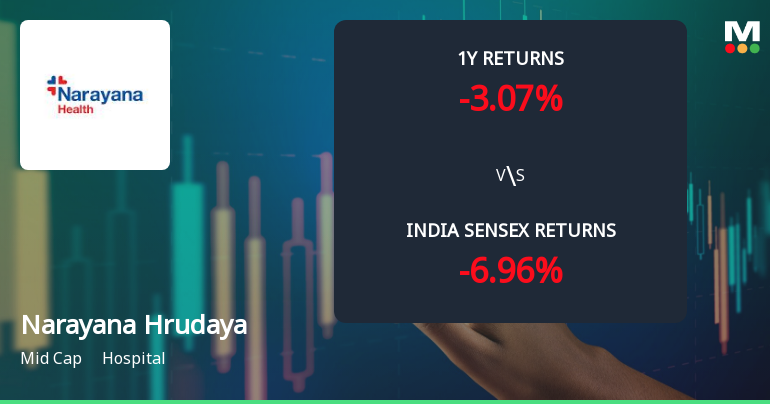
Total Returns (Price + Dividend) 
Latest dividend: 4.509978856170389 per share ex-dividend date: Aug-01-2025
Risk Adjusted Returns v/s
Returns Beta

News
Narayana Hrudayalaya Ltd Technical Momentum Shifts Amid Mixed Indicator Signals
Narayana Hrudayalaya Ltd has exhibited a nuanced shift in its technical momentum, moving from a bullish to a mildly bullish stance as of late June 2026. This transition is underscored by mixed signals from key technical indicators such as MACD, RSI, moving averages, and Bollinger Bands, reflecting a complex but cautiously optimistic outlook for the hospital sector mid-cap stock.
Read full news article
Narayana Hrudayalaya Ltd Upgraded to Buy on Strong Technical and Financial Metrics
Narayana Hrudayalaya Ltd has been upgraded from a Hold to a Buy rating, reflecting improvements across technical indicators, valuation metrics, financial trends, and overall quality. The mid-cap hospital stock’s recent performance and underlying fundamentals have prompted this positive reassessment, signalling renewed investor confidence amid a challenging healthcare sector environment.
Read full news article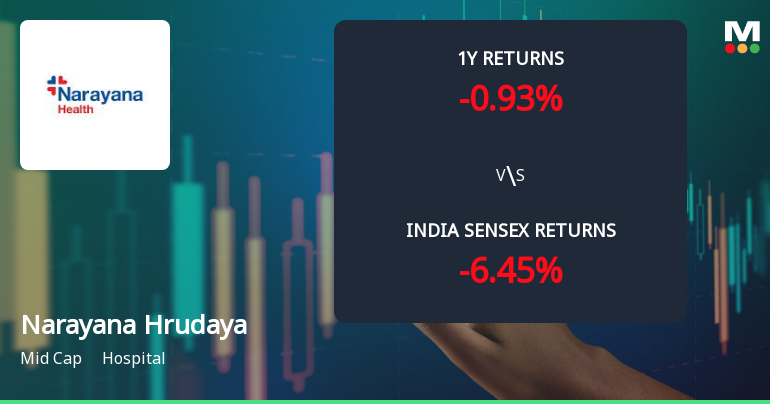
Narayana Hrudayalaya Ltd Technical Momentum Shifts Signal Bullish Outlook
Narayana Hrudayalaya Ltd has witnessed a notable shift in its technical momentum, upgrading from a mildly bullish to a bullish trend as of 23 Jun 2026. This change is supported by a confluence of technical indicators including MACD, moving averages, and Bollinger Bands, signalling renewed investor confidence in the hospital sector mid-cap stock.
Read full news article Announcements
Announcement under Regulation 30 (LODR)-Analyst / Investor Meet - Intimation
22-Jun-2026 | Source : BSEIntimation of Schedule of Group Investor Meeting to be held on June 26 2026
Announcement under Regulation 30 (LODR)-Newspaper Publication
12-Jun-2026 | Source : BSENewspaper Advertisement for the notice to the shareholders for the Transfer of equity shares to Investor Education and Protection Fund (IEPF)
Announcement under Regulation 30 (LODR)-Analyst / Investor Meet - Intimation
05-Jun-2026 | Source : BSEIntimation of Schedule of Group Investor Meeting to be held on June 11 2026
Corporate Actions

No Upcoming Board Meetings

Narayana Hrudayalaya Ltd has declared 45% dividend, ex-date: 17 Jul 26

No Splits history available

No Bonus history available

No Rights history available
Quality key factors
Valuation key factors
Technicals key factors
 Technical Indicator Scale: Bearish, Mildly Bearish, Sideways, Mildly Bullish, Bullish Turned
 Shareholding Snapshot : Mar 2026
Shareholding Compare (%holding)
Promoters
None
Held by 26 Schemes (7.24%)
Held by 250 FIIs (9.98%)
Shakuntala Shetty (34.8%)
Mirae Asset Infrastructure Fund (3.36%)
10.64%
Quarterly Results Snapshot (Consolidated) - Mar'26 - QoQ

QoQ Growth in quarter ended Mar 2026 is 20.58% vs 30.87% in Dec 2025

QoQ Growth in quarter ended Mar 2026 is 76.70% vs -50.96% in Dec 2025
Half Yearly Results Snapshot (Consolidated) - Sep'25
Growth in half year ended Sep 2025 is 17.89% vs 5.29% in Sep 2024
Growth in half year ended Sep 2025 is 13.75% vs -2.56% in Sep 2024
Nine Monthly Results Snapshot (Consolidated) - Dec'25
YoY Growth in nine months ended Dec 2025 is 32.31% vs 7.09% in Dec 2024
YoY Growth in nine months ended Dec 2025 is -1.89% vs -0.94% in Dec 2024
Annual Results Snapshot (Consolidated) - Mar'26
YoY Growth in year ended Mar 2026 is 44.01% vs 12.12% in Mar 2025
YoY Growth in year ended Mar 2026 is 1.95% vs 0.11% in Mar 2025
About Narayana Hrudayalaya Ltd

Company Coordinates


