
Compare Fredun Pharma with Similar Stocks
Dashboard
Healthy long term growth as Net Sales has grown by an annual rate of 36.42% and Operating profit at 59.04%
The company has declared Positive results for the last 8 consecutive quarters
With ROCE of 19.9, it has a Attractive valuation with a 3.8 Enterprise value to Capital Employed
Rising Promoter Confidence
Market Beating performance in long term as well as near term
Stock DNA
Pharmaceuticals & Biotechnology
INR 1,483 Cr (Micro Cap)
40.00
24
0.05%
0.56
13.65%
5.32
Total Returns (Price + Dividend) 
Latest dividend: 0.7 per share ex-dividend date: Jun-23-2026
Risk Adjusted Returns v/s
Returns Beta

News
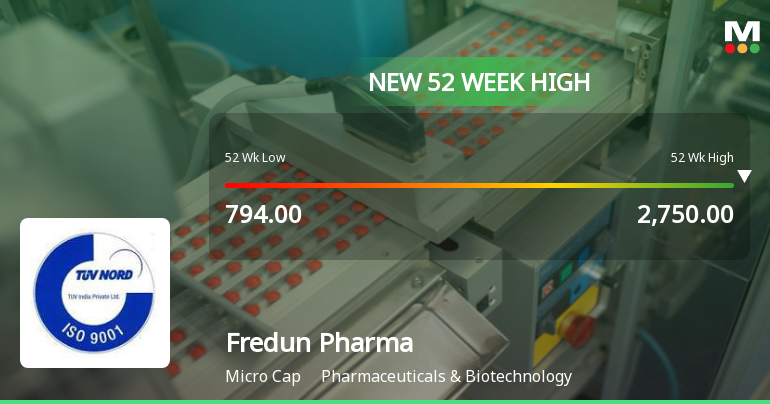
Broad-Based Technical Strength Lifts Fredun Pharmaceuticals Ltd to 52-Week High of Rs 2766
Surging to an all-time high of Rs 2766 on 29 Jun 2026, Fredun Pharmaceuticals Ltd has demonstrated remarkable price momentum, outperforming its sector and the broader market with a 238.62% gain over the past year. This milestone caps a sustained rally fuelled by a confluence of bullish technical indicators and robust trading volumes.
Read full news article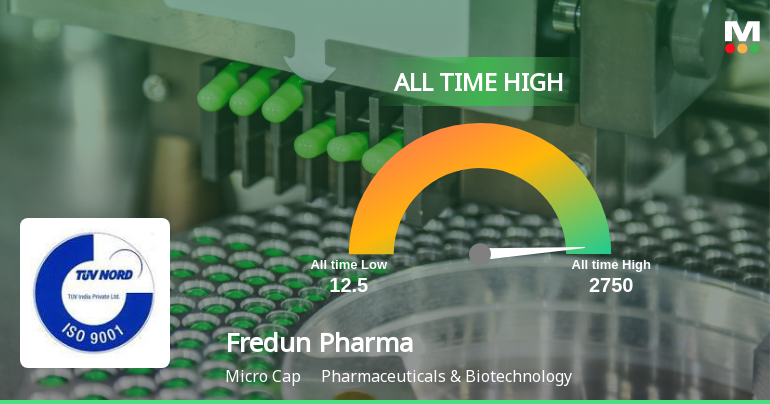
Fredun Pharmaceuticals Ltd Hits All-Time High of Rs 2,749.95 as Momentum Builds Across Timeframes
Extending its remarkable rally, Fredun Pharmaceuticals Ltd touched a fresh all-time high of Rs 2,749.95 on 29 Jun 2026, marking a significant milestone in its multi-year ascent that has outpaced the broader market by a wide margin.
Read full news article
Fredun Pharmaceuticals Ltd is Rated Buy
Fredun Pharmaceuticals Ltd is rated 'Buy' by MarketsMOJO, with this rating last updated on 30 May 2026. However, the analysis and financial metrics discussed here reflect the stock's current position as of 23 June 2026, providing investors with the latest insights into the company’s performance and outlook.
Read full news article Announcements
Closure of Trading Window
24-Jun-2026 | Source : BSEIntimation of Closure of Trading Window
Announcement under Regulation 30 (LODR)-Earnings Call Transcript
12-Jun-2026 | Source : BSETranscript of the Earnings conference call held on 10th June 2026 for Q4 FY26.
Announcement under Regulation 30 (LODR)-Analyst / Investor Meet - Outcome
10-Jun-2026 | Source : BSEAudio Recording of the Q4 and year ended for the FY26 Earnings Conference Call
Corporate Actions

No Upcoming Board Meetings

Fredun Pharmaceuticals Ltd has declared 7% dividend, ex-date: 23 Jun 26

No Splits history available

No Bonus history available

No Rights history available
Quality key factors
Valuation key factors
Technicals key factors
 Technical Indicator Scale: Bearish, Mildly Bearish, Sideways, Mildly Bullish, Bullish Turned
 Shareholding Snapshot : Mar 2026
Shareholding Compare (%holding)
Non Institution
None
Held by 0 Schemes
Held by 4 FIIs (1.06%)
Daulat Nariman Medhora (25.78%)
Nikhil Kishorchandra Vora (5.5%)
44.66%
Quarterly Results Snapshot (Standalone) - Mar'26 - YoY

YoY Growth in quarter ended Mar 2026 is 27.18% vs 41.15% in Mar 2025

YoY Growth in quarter ended Mar 2026 is 56.58% vs 39.72% in Mar 2025
Half Yearly Results Snapshot (Standalone) - Sep'25
Growth in half year ended Sep 2025 is 42.60% vs 29.23% in Sep 2024
Growth in half year ended Sep 2025 is 96.43% vs 32.49% in Sep 2024
Nine Monthly Results Snapshot (Standalone) - Dec'25
YoY Growth in nine months ended Dec 2025 is 47.73% vs 24.81% in Dec 2024
YoY Growth in nine months ended Dec 2025 is 96.50% vs 30.02% in Dec 2024
Annual Results Snapshot (Standalone) - Mar'26
YoY Growth in year ended Mar 2026 is 40.21% vs 30.33% in Mar 2025
YoY Growth in year ended Mar 2026 is 59.59% vs 33.23% in Mar 2025
About Fredun Pharmaceuticals Ltd

Company Coordinates


