
Compare Zeal Aqua with Similar Stocks
Dashboard
Weak Long Term Fundamental Strength with an average Return on Capital Employed (ROCE) of 7.43%
- Poor long term growth as Operating profit has grown by an annual rate 12.06% of over the last 5 years
- Low ability to service debt as the company has a high Debt to EBITDA ratio of 6.73 times
Flat results in Mar 26
Total Returns (Price + Dividend) 
Zeal Aqua for the last several years.
Risk Adjusted Returns v/s
Returns Beta

News
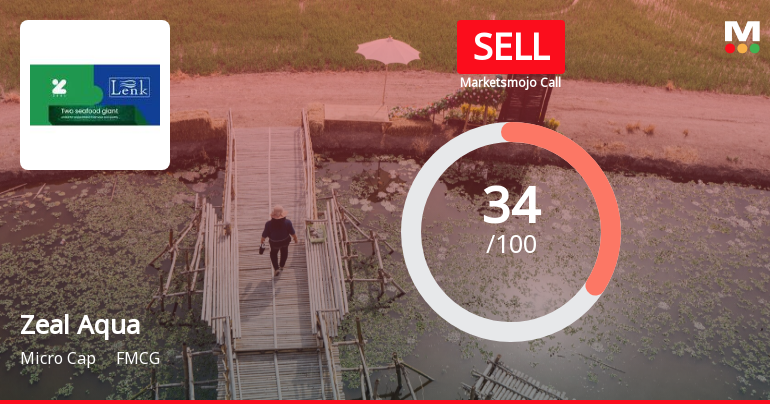
Zeal Aqua Ltd is Rated Sell by MarketsMOJO
Zeal Aqua Ltd is rated Sell by MarketsMOJO, with this rating last updated on 29 May 2026. While the rating change occurred on that date, the analysis and financial metrics discussed here reflect the stock’s current position as of 15 June 2026, providing investors with an up-to-date view of the company’s fundamentals, valuation, financial trend, and technical outlook.
Read full news article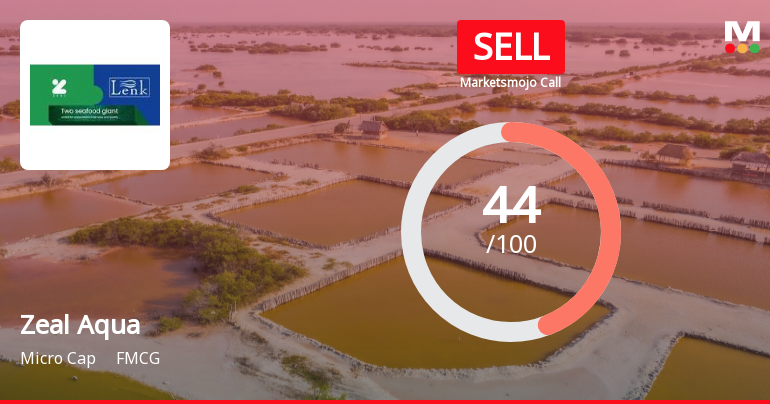
Zeal Aqua Ltd is Rated Sell
Zeal Aqua Ltd is rated 'Sell' by MarketsMOJO, with this rating last updated on 29 May 2026. While the rating change occurred on that date, the analysis and financial metrics discussed here reflect the stock's current position as of 01 June 2026, providing investors with the most up-to-date view of the company’s fundamentals, returns, and market standing.
Read full news article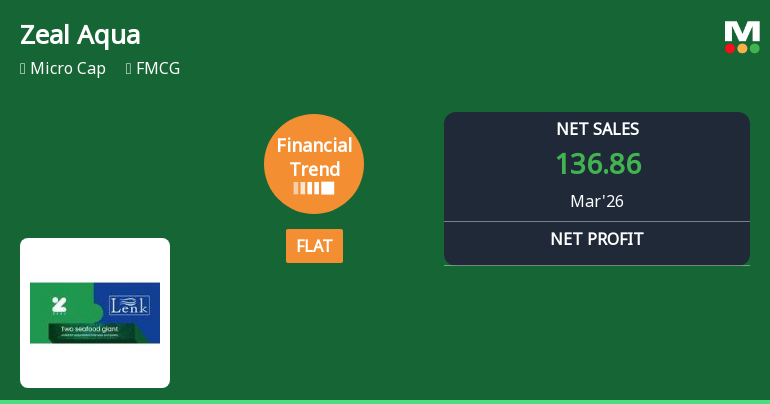
Zeal Aqua Ltd Reports Mixed Q4 2026 Results Amid Financial Trend Reversal
Zeal Aqua Ltd, a micro-cap player in the FMCG sector, has reported a flat financial performance for the quarter ended March 2026, signalling a notable shift from its previously positive growth trajectory. Despite a robust 33.4% increase in net sales, the company’s profitability metrics have deteriorated sharply, prompting a downgrade in its Mojo Grade from Hold to Sell as of 6 April 2026.
Read full news article Announcements
Intimation Under Regulation 30 Of SEBI (Listing Obligations And Disclosure Requirements) Regulations 2015 - Sanction/Availing Of Credit Facility From Indian Bank
09-Jun-2026 | Source : BSEAs attached.
Intimation Under Regulation 30 Of SEBI (Listing Obligations And Disclosure Requirements) Regulations 2015 - Sanction/Availing Of Credit Facility From Indian Bank
09-Jun-2026 | Source : BSEAs attached.
Announcement under Regulation 30 (LODR)-Newspaper Publication
30-May-2026 | Source : BSEAs attached.
Corporate Actions

No Upcoming Board Meetings

No Dividend history available

Zeal Aqua Ltd has announced 1:10 stock split, ex-date: 14 Oct 21

Zeal Aqua Ltd has announced 2:1 bonus issue, ex-date: 04 Oct 18

No Rights history available
Quality key factors
Valuation key factors
Technicals key factors
 Technical Indicator Scale: Bearish, Mildly Bearish, Sideways, Mildly Bullish, Bullish Turned
 Shareholding Snapshot : Mar 2026
Shareholding Compare (%holding)
Promoters
None
Held by 0 Schemes
Held by 0 FIIs
Agave Tradecom Llp (15.88%)
None
29.6%
Quarterly Results Snapshot (Standalone) - Mar'26 - YoY

YoY Growth in quarter ended Mar 2026 is 33.42% vs 57.72% in Mar 2025
YoY Growth in quarter ended Mar 2026 is -62.36% vs 12.92% in Mar 2025
Half Yearly Results Snapshot (Standalone) - Sep'25

Growth in half year ended Sep 2025 is 28.89% vs 21.91% in Sep 2024
Growth in half year ended Sep 2025 is 39.69% vs 64.97% in Sep 2024
Nine Monthly Results Snapshot (Standalone) - Dec'25
YoY Growth in nine months ended Dec 2025 is 29.83% vs 22.83% in Dec 2024
YoY Growth in nine months ended Dec 2025 is 25.60% vs 76.01% in Dec 2024
Annual Results Snapshot (Standalone) - Mar'26
YoY Growth in year ended Mar 2026 is 0.00% vs 28.54% in Mar 2025
YoY Growth in year ended Mar 2026 is -0.40% vs 22.13% in Mar 2025
About Zeal Aqua Ltd

Company Coordinates


