Tirupati Starch

  • Market Cap: Micro Cap
  • Industry: FMCG
  • ISIN: INE314D01011
  • NSEID:
  • BSEID: 524582
INR
131.00
3.5 (2.75%)
BSENSE

Sep 01, 03:30 PM

BSE+NSE Vol: 261

  • Price Points
  • Score
  • Mojo Parameters
  • Total Return
  • News and Corporate Actions
  • Key factors
  • Shareholding
  • Financials
  • CompanyCV
stock-summaryPrice Point
High/Low

1Day

52 Week

Valuation
Technical
Day's Volume

CASH

261 (-18.54%) Volume

Shareholding (Jun 2026)

FII

0.00%

Held by 0 FIIs

DII

0.13%

Held by 0 DIIs

Promoter

72.88%

Why is Tirupati Starch & Chemicals Ltd falling/rising?

01-Sep-2026

As of 31-Aug, Tirupati Starch & Chemicals Ltd's stock price is declining, currently at 127.50, down 8.27% with significant drops over various periods, including a year-to-date decrease of 23.17%. The stock is underperforming its sector and has seen a drastic reduction in investor participation, indicating a challenging market environment.

As of 31-Aug, Tirupati Starch & Chemicals Ltd is experiencing a decline in its stock price, currently at 127.50, which reflects a change of -11.5 (-8.27%). This downward movement is evident in the stock's performance over various periods, including a 1-week decline of -7.64% and a 1-month drop of -17.42%. Year-to-date, the stock has decreased by -23.17%, and over the past year, it has fallen by -31.03%. <BR><BR>Today's trading activity indicates that the stock has underperformed its sector by -2.45% and has been on a consecutive decline for the last three days, accumulating a total drop of -3.93% during this period. The stock reached an intraday low of Rs 122.25, marking a significant decrease of -12.05%. Furthermore, the stock has shown high volatility today, with an intraday volatility of 5.87%, and it is trading below its moving averages across various time frames, including the 5-day, 20-day, 50-day, 100-day, and 200-day averages.<BR><BR>Additionally, there has been a notable decline in investor participation, with delivery volume dropping by -99.81% compared to the 5-day average. This lack of engagement, combined with the stock's performance metrics, suggests a challenging environment for Tirupati Starch & Chemicals Ltd, contributing to the ongoing decline in its stock price.

View full answer

Who are in the management team of Tirupati Starch?

01-Sep-2026

The management team of Tirupati Starch includes Chairman Ramdas Goyal, Managing Director Amit Modi, and several Whole-time and Independent Directors, along with Company Secretary Ayushi Taunk, overseeing the company's operations and strategy.

The management team of Tirupati Starch includes the following individuals:<BR><BR>1. **Ramdas Goyal** - Chairman & Whole-time Director<BR>2. **Amit Modi** - Managing Director<BR>3. **Prakash Bafna** - Whole-time Director<BR>4. **Ramesh Chandra Goyal** - Whole-time Director<BR>5. **Yogesh Kumar Agrawal** - Whole-time Director<BR>6. **Pramila Jajodia** - Director<BR>7. **Shashikala Mangal** - Director<BR>8. **Ashish Agrawal** - Independent Director<BR>9. **Vinod Kumar Garg** - Independent Director<BR>10. **Nitin Kumar Gupta** - Independent Director<BR>11. **Ramesh Agrawal** - Independent Director<BR>12. **Ayushi Taunk** - Company Secretary & Compliance Officer<BR><BR>This team is responsible for overseeing the company's operations and strategic direction.

View full answer

What does Tirupati Starch do?

01-Sep-2026

Tirupati Starch & Chemicals Ltd manufactures and distributes starch products in the FMCG sector. As of June 2026, it reported net sales of ₹92 Cr and a net profit of ₹1 Cr, with a market cap of ₹133 Cr.

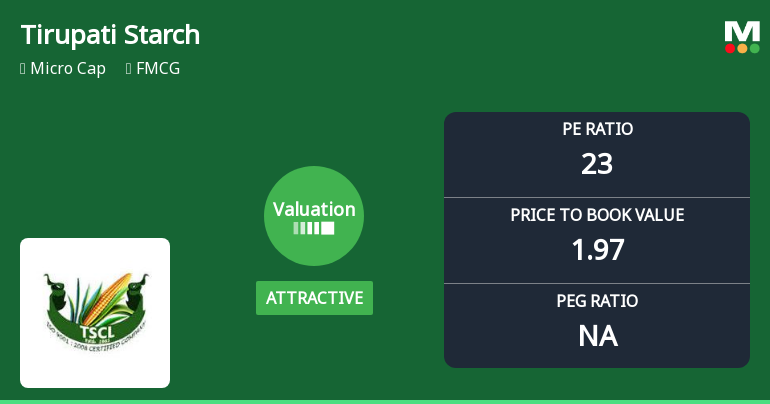
Overview: <BR>Tirupati Starch & Chemicals Ltd is engaged in the manufacturing and distribution of various starch products and belongs to the FMCG industry within the micro-cap market segment.<BR><BR>History: <BR>Incorporated in December 1985, Tirupati Starch & Chemicals Ltd commenced its commercial production in December 1989. The company expanded its operations with a Forward Integration Project in 1996, producing Dextrous Anhydrous and Dextrous Monohydrate. The latest reported quarterly results are for June 2026, showing net sales and profit.<BR><BR>Financial Snapshot: <BR>Net Sales: 92 Cr (Quarterly Results - Jun 2026) <BR>Net Profit: 1 Cr (Quarterly Results - Jun 2026) <BR>Market Cap: INR 133 Cr (Micro Cap)<BR><BR>Key Metrics: <BR>P/E: 21.00 <BR>Industry P/E: 43 <BR>Dividend Yield: 0.00% <BR>Debt Equity: 1.63 <BR>Return on Equity: 9.72% <BR>Price to Book: 1.99 <BR><BR>Contact Details: <BR>Address: Shreeram Chambers 1st Floor, 12 Agrawal Nagar Main Road Indore Madhya Pradesh : 452001 <BR>Tel: 91-0731-254001/254002 <BR>Email: tirupati@tirupatistarch.com <BR>Website: http://www.tirupatistarch.com

View full answer

Who are the peers of the Tirupati Starch?

01-Sep-2026

Tirupati Starch's peers include NHC Foods, Choksi Asia, Aayush Wellness, Zeal Aqua, Mayank Cattle Fo, Vistar Amar, Bengal Tea & Fab, and TBI Corn. In terms of performance, Vistar Amar leads with a 1-year return of 58.03%, while Tirupati Starch has a return of -31.03%.

Peers: The peers of Tirupati Starch are NHC Foods, Choksi Asia, Aayush Wellness, Zeal Aqua, Mayank Cattle Fo, Vistar Amar, Bengal Tea & Fab, and TBI Corn.<BR><BR>Quality Snapshot: Excellent management risk is observed at NHC Foods and TBI Corn, while Good management risk is found at Aayush Wellness. Average management risk is present at Choksi Asia, Mayank Cattle Fo, Vistar Amar, Bengal Tea & Fab, and Tirupati Starch. For Growth, Excellent growth is noted at NHC Foods and Vistar Amar, while Good growth is seen at Choksi Asia and Average growth at Mayank Cattle Fo. Below Average growth is reported for Tirupati Starch, Aayush Wellness, Zeal Aqua, and Bengal Tea & Fab. In terms of Capital Structure, Excellent capital structure is found at Vistar Amar, Good at Choksi Asia and Bengal Tea & Fab, while Average is noted at NHC Foods and Mayank Cattle Fo, and Below Average at Tirupati Starch, Zeal Aqua, and Aayush Wellness.<BR><BR>Return Snapshot: The peer with the highest 1-year return is Vistar Amar at 58.03%, while Aayush Wellness has the lowest at -61.84%. Tirupati Starch's 1-year return is -31.03%, which is better than Aayush Wellness but worse than Vistar Amar. Additionally, the six-month return is negative for Tirupati Starch, Zeal Aqua, Mayank Cattle Fo, and Bengal Tea & Fab.

View full answer

How big is Tirupati Starch?

01-Sep-2026

As of 31st August, Tirupati Starch & Chemicals Ltd has a market capitalization of 133.00 Cr, with recent net sales of 362.66 Cr and a net profit of 5.69 Cr. The company has shareholder's funds of 67.15 Cr and total assets of 210.12 Cr as of March 2026.

As of 31st August, Tirupati Starch & Chemicals Ltd has a market capitalization of 133.00 Cr, classifying it as a Micro Cap company.<BR><BR>In the latest four quarters, Tirupati Starch reported Net Sales of 362.66 Cr and a Net Profit of 5.69 Cr.<BR><BR>For the latest annual period ending in March 2026, the company has Shareholder's Funds amounting to 67.15 Cr and Total Assets of 210.12 Cr.

View full answer

Should I buy, sell or hold Tirupati Starch & Chemicals Ltd?

16-Aug-2026

When is the next results date for Tirupati Starch & Chemicals Ltd?

06-Aug-2026

The next results date for Tirupati Starch & Chemicals Ltd is 14 August 2026.

The next results date for Tirupati Starch & Chemicals Ltd is scheduled for 14 August 2026.

View full answer

Are Tirupati Starch & Chemicals Ltd latest results good or bad?

02-Jun-2026

Tirupati Starch & Chemicals Ltd's latest results show a significant net profit increase of 58.44% year-on-year, but revenue declined by 7.84%, raising concerns about sustainability. The company's high debt levels and lack of institutional interest further complicate its outlook, indicating caution is warranted.

Tirupati Starch & Chemicals Ltd's latest results present a mixed picture. On one hand, the company reported a net profit of ₹2.44 crores for Q4 FY26, which is a significant increase of 58.44% year-on-year, indicating improved profitability compared to the same quarter last year. Additionally, the operating margin improved to 8.69%, marking the highest level in seven quarters, which suggests better cost management.<BR><BR>However, the company is facing challenges with its revenue. Net sales for the quarter were ₹89.86 crores, reflecting a decline of 7.84% year-on-year and a decrease of 2.26% compared to the previous quarter. This marks the third consecutive quarter of year-on-year revenue decline, raising concerns about the sustainability of the company's profitability amidst falling sales.<BR><BR>Moreover, the company's high leverage, with a debt-to-equity ratio of 2.17, poses significant risks to its financial flexibility and growth potential. The absence of institutional interest further complicates its outlook, as it indicates a lack of confidence from professional investors.<BR><BR>In summary, while there are positive signs in terms of profit margins, the persistent decline in revenue and high debt levels suggest that the overall results are concerning, and caution is warranted regarding the company's future performance.

View full answer

How has been the historical performance of Tirupati Starch?

24-Nov-2025

Tirupati Starch's historical performance shows mixed results, with net sales increasing from 364.21 Cr in Mar'23 to 386.22 Cr in Mar'25, despite a dip in Mar'24. Profitability improved significantly, with profit after tax rising to 7.53 Cr in Mar'25, while total assets and liabilities also grew during the period.

Answer:<BR>The historical performance of Tirupati Starch shows a mixed trend in its financial metrics over the past three years.<BR><BR>Breakdown:<BR>Tirupati Starch's net sales increased from 364.21 Cr in Mar'23 to 386.22 Cr in Mar'25, with a dip in Mar'24 to 306.11 Cr. Total operating income followed a similar pattern, peaking in Mar'25 at 386.22 Cr. The raw material cost rose significantly from 260.47 Cr in Mar'23 to 288.63 Cr in Mar'25, contributing to a total expenditure of 361.50 Cr in Mar'25, up from 343.19 Cr in Mar'23. Operating profit (PBDIT) improved to 28.73 Cr in Mar'25 from 21.60 Cr in Mar'23, while profit before tax also saw a notable increase to 10.17 Cr in Mar'25 compared to 3.17 Cr in Mar'24. Profit after tax reached 7.53 Cr in Mar'25, up from 2.19 Cr in Mar'24. The company's total assets grew from 169.12 Cr in Mar'23 to 230.47 Cr in Mar'25, with total liabilities also increasing to 230.47 Cr in Mar'25 from 169.12 Cr in Mar'23. Cash flow from operating activities turned positive at 48.00 Cr in Mar'25, contrasting with a negative cash flow of -34.00 Cr in Mar'24. Overall, Tirupati Starch has shown improvement in sales and profitability, although costs and liabilities have also risen.

View full answer

Is Tirupati Starch overvalued or undervalued?

18-Nov-2025

As of November 17, 2025, Tirupati Starch is considered undervalued with a PE ratio of 17.13 and an attractive valuation grade, outperforming the Sensex with a year-to-date return of 25.92%, especially when compared to peers like Solar Industries and Gujarat Fluoroch.

As of 17 November 2025, the valuation grade for Tirupati Starch has moved from fair to attractive, indicating a positive shift in its market perception. The company is currently assessed as undervalued, with a PE ratio of 17.13, an EV to EBITDA of 11.26, and a ROE of 16.95%. These ratios suggest that Tirupati Starch is positioned favorably compared to its peers, particularly when contrasted with Solar Industries, which has a significantly higher PE ratio of 95.31, and Gujarat Fluoroch, with a PE of 57.85.<BR><BR>In addition to its attractive valuation, Tirupati Starch has demonstrated strong performance relative to the Sensex, with a year-to-date return of 25.92% compared to the Sensex's 8.72%. This performance, alongside its solid financial ratios, reinforces the conclusion that the company is undervalued in the current market environment.

View full answer

What is the technical trend for Tirupati Starch?

09-Jun-2025

As of June 6, 2025, Tirupati Starch shows a mildly bearish trend, supported by bearish MACD and Bollinger Bands, despite a mildly bullish daily moving average.

As of 6 June 2025, the technical trend for Tirupati Starch has changed from sideways to mildly bearish. The weekly MACD is bearish, and the monthly MACD is mildly bearish, indicating a negative momentum. Bollinger Bands are bearish on both weekly and monthly time frames, further supporting the bearish outlook. The KST is also bearish weekly and mildly bearish monthly. Moving averages on the daily time frame show a mildly bullish stance, but this is overshadowed by the overall bearish indicators. The Dow Theory indicates no trend on both weekly and monthly time frames. Overall, the current stance is mildly bearish, driven primarily by the MACD and Bollinger Bands.

View full answer

Who are the top shareholders of the Tirupati Starch?

06-Jun-2025

The top shareholder of Tirupati Starch is promoter Amit Modi, holding 6.77% of the shares. Individual investors own 25.24%, while mutual funds hold 0.26%, and there are no foreign institutional investors.

The top shareholders of Tirupati Starch primarily consist of promoters, with Amit Modi being the promoter with the highest holding at 6.77%. There are no pledged promoter holdings, and individual investors collectively hold 25.24% of the shares. Additionally, two mutual fund schemes hold a small portion of 0.26%, while there are currently no foreign institutional investors (FIIs) involved in the company's shareholding.

View full answer

Has Tirupati Starch declared dividend?

06-Jun-2025

No Dividend History Available

iScoreScore
Click here to find our call on this stock
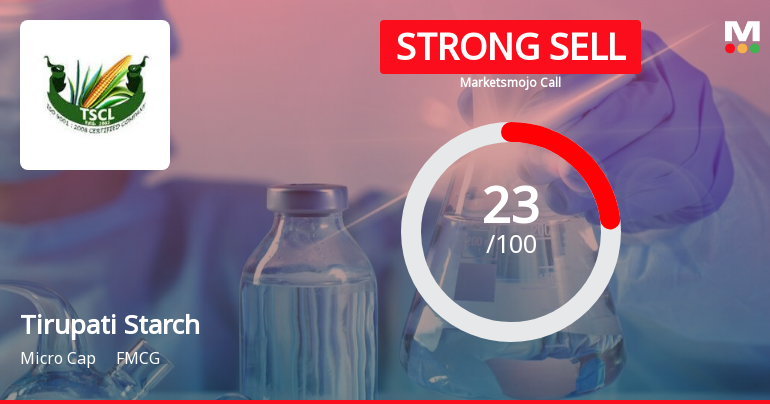
Strong Sell
Sell
Hold
Buy
Strong Buy

Dashboard

1

Weak Long Term Fundamental Strength with a -1.33% CAGR growth in Operating Profits over the last 5 years

  • Low ability to service debt as the company has a high Debt to EBITDA ratio of 4.45 times
  • The company has been able to generate a Return on Equity (avg) of 8.73% signifying low profitability per unit of shareholders funds
2

Flat results in Jun 26

3

Underperformed the market in the last 1 year

stock-summaryMojo Parameters

Mojo Parameters

Loading Valuation Snapshot...

Stock DNA

stock-summary
Industry

FMCG

stock-summary
Market cap

INR 122 Cr (Micro Cap)

stock-summary
P/E

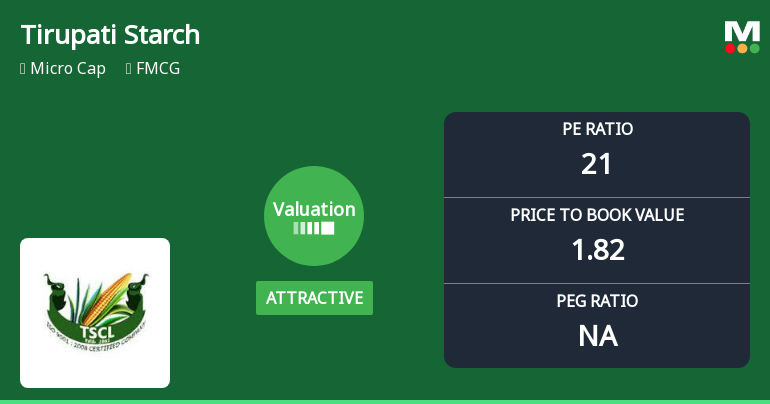
22.00

stock-summary
Industry P/E

43

stock-summary
Dividend Yield

0.00%

stock-summary
Debt Equity

1.63

stock-summary
Return on Equity

9.72%

stock-summary
Price to Book

1.82

Revenue and Profits:
Net Sales:
92 Cr
(Quarterly Results - Jun 2026)
Net Profit:
1 Cr
stock-summaryTotal Returns
Total Returns (Price + Dividend) stock-summary
Dividend Yield (0%)
TimePeriod
Price Return
Dividend Return
Total Return
3 Months
0.08%
0%
0.08%
6 Months
-20.32%
0%
-20.32%
1 Year
-29.76%
0%
-29.76%
2 Years
-19.9%
0%
-19.9%
3 Years
55.4%
0%
55.4%
4 Years
77.15%
0%
77.15%
5 Years
184.47%
0%
184.47%

Tirupati Starch for the last several years.

Risk Adjusted Returns v/s stock-summary
Returns Beta
Icon
Beta has not been calculated since enough price history is not available
stock-summaryNews & Corporate Actions

News

Announcements stock-summary

Announcement under Regulation 30 (LODR)-Newspaper Publication

21-Aug-2026 | Source : BSE

Submission of Newspaper advertisement published for Notice of 40 Annual general Meeting and E-voting information.

Intimation Regarding Dispatch Of Letters U/R 36(1)(B) Of SEBI (LODR) Reg. 2015 To Those Shareholder(S) Whose Email Address(Es) Are Not Registered With The Company/RTA/Depositories

20-Aug-2026 | Source : BSE

Intimation regarding dispatch of letters to those shareholders whose email not registered with Company/RTA/Depositories

Announcement under Regulation 30 (LODR)-Newspaper Publication

20-Aug-2026 | Source : BSE

Submission of Newspaper publication regarding - special Window

Corporate Actions stock-summary

stock-summary
BOARD MEETING

No Upcoming Board Meetings

stock-summary
DIVIDEND

No Dividend history available

stock-summary
SPLITS

No Splits history available

stock-summary
BONUS

No Bonus history available

stock-summary
RIGHTS

No Rights history available

stock-summaryKey Factors

Quality key factors stock-summary

Factor
Value
Sales Growth (5y)
2.20%
EBIT Growth (5y)
-1.33%
EBIT to Interest (avg)
1.57
Debt to EBITDA (avg)
5.59
Net Debt to Equity (avg)
1.63
Sales to Capital Employed (avg)
1.97
Tax Ratio
30.01%
Dividend Payout Ratio
0
Pledged Shares
0
Institutional Holding
0.13%
ROCE (avg)
8.84%
ROE (avg)
8.73%

Valuation key factors

Factor
Value
P/E Ratio
22
Industry P/E
43
Price to Book Value
1.87
EV to EBIT
15.58
EV to EBITDA
10.12
EV to Capital Employed
1.33
EV to Sales
0.65
PEG Ratio
NA
Dividend Yield
NA
ROCE (Latest)
9.24%
ROE (Latest)
9.72%

Technicals key factors

Indicator
Weekly
Monthly
MACD
Bearish
Bearish
RSI
No Signal
No Signal
Bollinger Bands
Bearish
Mildly Bearish
Moving Averages
Bearish (Daily)
KST
Bullish
Bearish
Dow Theory
Mildly Bearish
No Trend
stock-summary Technical Indicator Scale: Bearish, Mildly Bearish, Sideways, Mildly Bullish, Bullish  Turned 
stock-summaryShareholding
Shareholding Snapshot : Jun 2026stock-summary
Shareholding Compare (%holding) stock-summary
Majority shareholders

Promoters

Pledged Promoter Holdings

None

Mutual Funds

Held by 1 Schemes (0.13%)

FIIs

Held by 0 FIIs

Promoter with highest holding

Amit Modi (6.77%)

Highest Public shareholder

Priya Singh Aggarwal (1.3%)

Individual Investors Holdings

25.4%

stock-summaryFinancial
[
  {
    "link": "quarterly",
    "btn_text": "All Quarterly Results",
    "header": "Quarterly Results Snapshot (Consolidated) - Jun'26 - QoQ",
    "rhs": [
      {
        "prefix": "Net Sales ",
        "suffix": "QoQ Growth in quarter ended Jun 2026 is 1.97% vs -2.26% in Mar 2026",
        "dir": 1
      },
      {
        "prefix": "Consolidated Net Profit ",
        "suffix": "QoQ Growth in quarter ended Jun 2026 is -68.03% vs -0.81% in Mar 2026",
        "dir": -1
      }
    ],
    "table": {
      "header": [
        "Jun'26",
        "Mar'26",
        "Change(%)"
      ],
      "body": [
        {
          "field": "Net Sales",
          "val1": "91.63",
          "val2": "89.86",
          "chgp": "1.97%",
          "chgp_class": "positive"
        },
        {
          "field": "Operating Profit (PBDIT) excl Other Income",
          "val1": "5.24",
          "val2": "7.81",
          "chgp": "-32.91%",
          "chgp_class": "negative"
        },
        {
          "field": "Interest",
          "val1": "2.44",
          "val2": "2.28",
          "chgp": "7.02%",
          "chgp_class": "negative"
        },
        {
          "field": "Exceptional Items",
          "val1": "0.00",
          "val2": "0.00",
          "chgp": "",
          "chgp_class": "neutral"
        },
        {
          "field": "Consolidate Net Profit",
          "val1": "0.78",
          "val2": "2.44",
          "chgp": "-68.03%",
          "chgp_class": "negative"
        },
        {
          "field": "Operating Profit Margin (Excl OI)",
          "val1": "5.72%",
          "val2": "8.69%",
          "chgp": "-2.97%",
          "chgp_class": "negative"
        }
      ]
    }
  },
  {
    "link": "half-yearly",
    "btn_text": "All Half Yearly Results",
    "header": "Half Yearly Results Snapshot (Consolidated) - Sep'25",
    "rhs": [
      {
        "prefix": "Net Sales ",
        "suffix": " Growth in half year ended Sep 2025 is -4.24% vs 38.48% in Sep 2024",
        "dir": -1
      },
      {
        "prefix": "Consolidated Net Profit ",
        "suffix": " Growth in half year ended Sep 2025 is 209.15% vs -344.83% in Sep 2024",
        "dir": 1
      }
    ],
    "table": {
      "header": [
        "Sep'25",
        "Sep'24",
        "Change(%)"
      ],
      "body": [
        {
          "field": "Net Sales",
          "val1": "181.46",
          "val2": "189.50",
          "chgp": "-4.24%",
          "chgp_class": "negative"
        },
        {
          "field": "Operating Profit (PBDIT) excl Other Income",
          "val1": "11.00",
          "val2": "7.62",
          "chgp": "44.36%",
          "chgp_class": "positive"
        },
        {
          "field": "Interest",
          "val1": "5.53",
          "val2": "5.42",
          "chgp": "2.03%",
          "chgp_class": "negative"
        },
        {
          "field": "Exceptional Items",
          "val1": "0.00",
          "val2": "0.00",
          "chgp": "",
          "chgp_class": "neutral"
        },
        {
          "field": "Consolidate Net Profit",
          "val1": "1.55",
          "val2": "-1.42",
          "chgp": "209.15%",
          "chgp_class": "positive"
        },
        {
          "field": "Operating Profit Margin (Excl OI)",
          "val1": "6.06%",
          "val2": "4.02%",
          "chgp": "2.04%",
          "chgp_class": "positive"
        }
      ]
    }
  },
  {
    "link": "nine-monthly",
    "btn_text": "All Nine Monthly Results",
    "header": "Nine Monthly Results Snapshot (Consolidated) - Dec'25",
    "rhs": [
      {
        "prefix": "Net Sales ",
        "suffix": "YoY Growth in nine months ended Dec 2025 is -5.31% vs 29.11% in Dec 2024",
        "dir": -1
      },
      {
        "prefix": "Consolidated Net Profit ",
        "suffix": "YoY Growth in nine months ended Dec 2025 is -33.06% vs 265.24% in Dec 2024",
        "dir": -1
      }
    ],
    "table": {
      "header": [
        "Dec'25",
        "Dec'24",
        "Change(%)"
      ],
      "body": [
        {
          "field": "Net Sales",
          "val1": "273.40",
          "val2": "288.72",
          "chgp": "-5.31%",
          "chgp_class": "negative"
        },
        {
          "field": "Operating Profit (PBDIT) excl Other Income",
          "val1": "16.95",
          "val2": "21.01",
          "chgp": "-19.32%",
          "chgp_class": "negative"
        },
        {
          "field": "Interest",
          "val1": "7.96",
          "val2": "7.91",
          "chgp": "0.63%",
          "chgp_class": "negative"
        },
        {
          "field": "Exceptional Items",
          "val1": "0.00",
          "val2": "0.00",
          "chgp": "",
          "chgp_class": "neutral"
        },
        {
          "field": "Consolidate Net Profit",
          "val1": "4.01",
          "val2": "5.99",
          "chgp": "-33.06%",
          "chgp_class": "negative"
        },
        {
          "field": "Operating Profit Margin (Excl OI)",
          "val1": "6.20%",
          "val2": "7.28%",
          "chgp": "-1.08%",
          "chgp_class": "negative"
        }
      ]
    }
  },
  {
    "link": "annual",
    "btn_text": "All Annual Results",
    "header": "Annual Results Snapshot (Consolidated) - Mar'26",
    "rhs": [
      {
        "prefix": "Net Sales ",
        "suffix": "YoY Growth in year ended Mar 2026 is -5.94% vs 26.17% in Mar 2025",
        "dir": -1
      },
      {
        "prefix": "Consolidated Net Profit ",
        "suffix": "YoY Growth in year ended Mar 2026 is -14.21% vs 243.84% in Mar 2025",
        "dir": -1
      }
    ],
    "table": {
      "header": [
        "Mar'26",
        "Mar'25",
        "Change(%)"
      ],
      "body": [
        {
          "field": "Net Sales",
          "val1": "363.26",
          "val2": "386.22",
          "chgp": "-5.94%",
          "chgp_class": "negative"
        },
        {
          "field": "Operating Profit (PBDIT) excl Other Income",
          "val1": "24.76",
          "val2": "24.72",
          "chgp": "0.16%",
          "chgp_class": "positive"
        },
        {
          "field": "Interest",
          "val1": "10.24",
          "val2": "10.71",
          "chgp": "-4.39%",
          "chgp_class": "positive"
        },
        {
          "field": "Exceptional Items",
          "val1": "0.00",
          "val2": "0.00",
          "chgp": "",
          "chgp_class": "neutral"
        },
        {
          "field": "Consolidate Net Profit",
          "val1": "6.46",
          "val2": "7.53",
          "chgp": "-14.21%",
          "chgp_class": "negative"
        },
        {
          "field": "Operating Profit Margin (Excl OI)",
          "val1": "6.82%",
          "val2": "6.40%",
          "chgp": "0.42%",
          "chgp_class": "positive"
        }
      ]
    }
  }
]

Quarterly Results Snapshot (Consolidated) - Jun'26 - QoQstock-summary

Jun'26
Mar'26
Change(%)
Net Sales
91.63
89.86
1.97%
Operating Profit (PBDIT) excl Other Income
5.24
7.81
-32.91%
Interest
2.44
2.28
7.02%
Exceptional Items
0.00
0.00
Consolidate Net Profit
0.78
2.44
-68.03%
Operating Profit Margin (Excl OI)
5.72%
8.69%
-2.97%
Values in Rs Cr.
Direction Arrows
Net Sales

QoQ Growth in quarter ended Jun 2026 is 1.97% vs -2.26% in Mar 2026

Direction Arrows
Consolidated Net Profit

QoQ Growth in quarter ended Jun 2026 is -68.03% vs -0.81% in Mar 2026

Half Yearly Results Snapshot (Consolidated) - Sep'25stock-summary

Sep'25
Sep'24
Change(%)
Net Sales
181.46
189.50
-4.24%
Operating Profit (PBDIT) excl Other Income
11.00
7.62
44.36%
Interest
5.53
5.42
2.03%
Exceptional Items
0.00
0.00
Consolidate Net Profit
1.55
-1.42
209.15%
Operating Profit Margin (Excl OI)
6.06%
4.02%
2.04%
Values in Rs Cr.
Direction Arrows
Net Sales

Growth in half year ended Sep 2025 is -4.24% vs 38.48% in Sep 2024

Direction Arrows
Consolidated Net Profit

Growth in half year ended Sep 2025 is 209.15% vs -344.83% in Sep 2024

Nine Monthly Results Snapshot (Consolidated) - Dec'25stock-summary

Dec'25
Dec'24
Change(%)
Net Sales
273.40
288.72
-5.31%
Operating Profit (PBDIT) excl Other Income
16.95
21.01
-19.32%
Interest
7.96
7.91
0.63%
Exceptional Items
0.00
0.00
Consolidate Net Profit
4.01
5.99
-33.06%
Operating Profit Margin (Excl OI)
6.20%
7.28%
-1.08%
Values in Rs Cr.
Direction Arrows
Net Sales

YoY Growth in nine months ended Dec 2025 is -5.31% vs 29.11% in Dec 2024

Direction Arrows
Consolidated Net Profit

YoY Growth in nine months ended Dec 2025 is -33.06% vs 265.24% in Dec 2024

Annual Results Snapshot (Consolidated) - Mar'26stock-summary

Mar'26
Mar'25
Change(%)
Net Sales
363.26
386.22
-5.94%
Operating Profit (PBDIT) excl Other Income
24.76
24.72
0.16%
Interest
10.24
10.71
-4.39%
Exceptional Items
0.00
0.00
Consolidate Net Profit
6.46
7.53
-14.21%
Operating Profit Margin (Excl OI)
6.82%
6.40%
0.42%
Values in Rs Cr.
Direction Arrows
Net Sales

YoY Growth in year ended Mar 2026 is -5.94% vs 26.17% in Mar 2025

Direction Arrows
Consolidated Net Profit

YoY Growth in year ended Mar 2026 is -14.21% vs 243.84% in Mar 2025

stock-summaryCompany CV
About Tirupati Starch & Chemicals Ltd stock-summary
stock-summary
Tirupati Starch & Chemicals Ltd
Micro Cap
FMCG
Incorporated in Dec.'85, Tirupati Starch & Chemicals Limited(TSCL) was promoted by Damodar Modi. The Company is engaged in Manufacturing of and distribution of Maize Starch Powder, Dextrose Anhydrous, Dextrose Monohydrate, Liquid Glucose, Tirulose, Vervosize, White Dextrin, Yellow Dextrin, etc. The Company commenced its commercial production in Dec.'89. It expanded the Forward Integration Project in 1996 and started producing Dextrous Anhydrous and Dextrous Monohydrate.
Company Coordinates stock-summary
Company Details
Shreeram Chambers 1st Floor, 12 Agrawal Nagar Main Road Indore Madhya Pradesh : 452001
stock-summary
Tel: 91-0731-254001/254002
stock-summary
tirupati@tirupatistarch.com
Registrar Details
Ankit Consultancy Pvt Ltd, Plot No 60, Electronic Complex, Pardeshipura, Indore