
Compare Aditya Vision with Similar Stocks
Dashboard
High Management Efficiency with a high ROCE of 19.80%
Healthy long term growth as Net Sales has grown by an annual rate of 29.00% and Operating profit at 31.36%
Flat results in Mar 26
With ROCE of 16.6, it has a Expensive valuation with a 7.7 Enterprise value to Capital Employed
High Institutional Holdings at 35.76%
Market Beating performance in long term as well as near term
Total Returns (Price + Dividend) 
Latest dividend: 1.1 per share ex-dividend date: Jul-08-2025
Risk Adjusted Returns v/s
Returns Beta

News
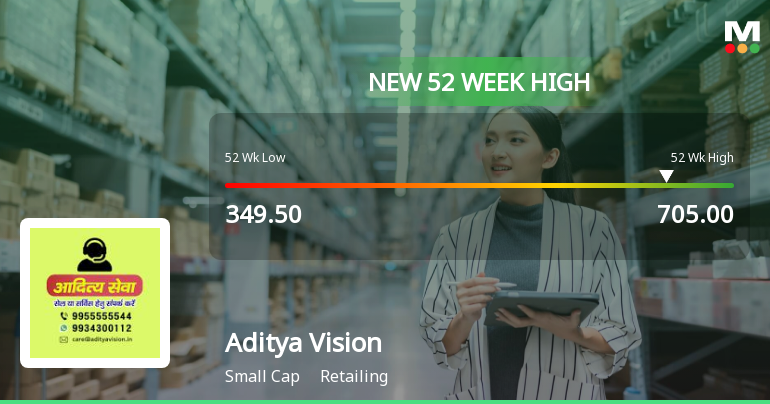
Broad-Based Technical Strength Lifts Aditya Vision Ltd to 52-Week High of Rs 705
Surging past the Rs 700 mark for the first time in 52 weeks, Aditya Vision Ltd has demonstrated remarkable price momentum, outpacing its retailing sector peers and the broader market with a 68.7% gain over the past year. This milestone caps a sustained rally that has seen the stock more than double from its 52-week low of Rs 349.5, underscoring a powerful technical alignment across multiple timeframes.
Read full news article
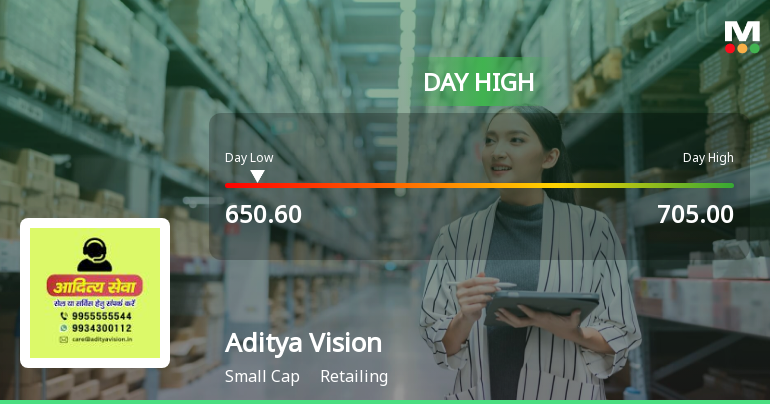
Aditya Vision Ltd Surges 7.61% to Day's High of Rs 676.75 — Outperforms Sector by 4.57 Percentage Points
The Sensex advanced 0.55% on 25 Jun 2026, yet Aditya Vision Ltd outpaced the broader market with a robust 7.61% gain, reaching an intraday high of Rs 676.75. This 4.57-percentage-point outperformance over the Retailing sector signals a distinctly stock-specific rally rather than a market-wide lift.
Read full news article Announcements
Announcement under Regulation 30 (LODR)-Analyst / Investor Meet - Intimation
03-Jun-2026 | Source : BSEPursuant to the Regulation 30 of SEBI (Listing Obligations and Disclosure Requirements) Regulations 2015 we would like to inform you that the officials of the Company will be participating in the Non-Deal Roadshow mentioned below:-
Announcement under Regulation 30 (LODR)-Analyst / Investor Meet - Intimation
27-May-2026 | Source : BSEPursuant to the Regulation 30(6) of SEBI (Listing Obligations and Disclosure Requirements) Regulations 2015 we would like to inform you that the officials of the Company will be meeting Analysts/Investors (Participants) as per the details given below:
Announcement Under Regulation 30 Of SEBI LODR (Opening Of 210Th Showroom)
22-May-2026 | Source : BSEOpening of Showroom
Corporate Actions

No Upcoming Board Meetings

Aditya Vision Ltd has declared 110% dividend, ex-date: 08 Jul 25

Aditya Vision Ltd has announced 1:10 stock split, ex-date: 27 Aug 24

No Bonus history available

No Rights history available
Quality key factors
Valuation key factors
Technicals key factors
 Technical Indicator Scale: Bearish, Mildly Bearish, Sideways, Mildly Bullish, Bullish Turned
 Shareholding Snapshot : Mar 2026
Shareholding Compare (%holding)
Promoters
None
Held by 12 Schemes (18.97%)
Held by 77 FIIs (16.18%)
Yashovardhan Sinha (27.38%)
Hdfc Small Cap Fund (7.52%)
15.81%
Quarterly Results Snapshot (Standalone) - Mar'26 - YoY

YoY Growth in quarter ended Mar 2026 is 28.42% vs 29.55% in Mar 2025
YoY Growth in quarter ended Mar 2026 is 35.98% vs 103.57% in Mar 2025
Half Yearly Results Snapshot (Standalone) - Sep'25
Growth in half year ended Sep 2025 is 10.52% vs 32.51% in Sep 2024
Growth in half year ended Sep 2025 is 3.95% vs 38.77% in Sep 2024
Nine Monthly Results Snapshot (Standalone) - Dec'25
YoY Growth in nine months ended Dec 2025 is 15.43% vs 29.65% in Dec 2024
YoY Growth in nine months ended Dec 2025 is 6.33% vs 29.31% in Dec 2024
Annual Results Snapshot (Standalone) - Mar'26
YoY Growth in year ended Mar 2026 is 18.23% vs 29.63% in Mar 2025
YoY Growth in year ended Mar 2026 is 10.84% vs 36.88% in Mar 2025
About Aditya Vision Ltd

Company Coordinates


