
Compare Leading Lea. Fin with Similar Stocks
Stock DNA
Non Banking Financial Company (NBFC)
INR 75 Cr (Micro Cap)
4.00
21
0.00%
2.44
10.00%
0.40
Total Returns (Price + Dividend) 
Leading Lea. Fin for the last several years.
Risk Adjusted Returns v/s
Returns Beta

News

Leading Leasing Finance & Investment Company Ltd is Rated Sell
Leading Leasing Finance & Investment Company Ltd is rated 'Sell' by MarketsMOJO, with this rating last updated on 30 May 2026. However, the analysis and financial metrics discussed here reflect the stock's current position as of 17 June 2026, providing investors with an up-to-date perspective on the company’s fundamentals, valuation, financial trends, and technical outlook.
Read full news article
Leading Leasing Finance & Investment Company Ltd is Rated Sell
Leading Leasing Finance & Investment Company Ltd is rated 'Sell' by MarketsMOJO. This rating was last updated on 30 May 2026, reflecting a reassessment of the stock’s outlook. However, all fundamentals, returns, and financial metrics discussed here are current as of 08 June 2026, providing investors with the latest perspective on the company’s position.
Read full news article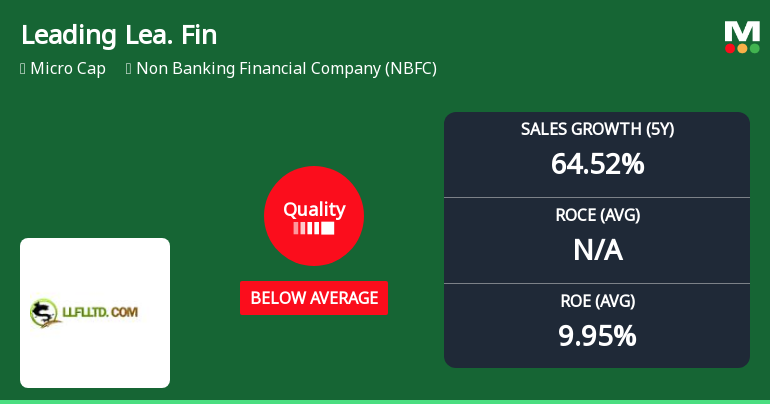
Leading Leasing Finance & Investment Company Ltd Downgraded as Quality Parameters Deteriorate
Leading Leasing Finance & Investment Company Ltd has recently experienced a downgrade in its quality grade from average to below average, reflecting a shift in its business fundamentals. This article analyses the key financial parameters including return on equity (ROE), return on capital employed (ROCE), debt levels, and growth consistency to understand the implications of this change for investors and market participants.
Read full news article Announcements
Announcement under Regulation 30 (LODR)-Newspaper Publication
02-Jun-2026 | Source : BSENewspaper Publication - Postal Ballot Notice and E-Voting Information
Shareholder Meeting / Postal Ballot-Notice of Postal Ballot
01-Jun-2026 | Source : BSEPostal Ballot Notice
Announcement under Regulation 30 (LODR)-Newspaper Publication
30-May-2026 | Source : BSENewspaper Publication of financial result for the quarter and year ended March 31 2026
Corporate Actions

No Upcoming Board Meetings

No Dividend history available

Leading Leasing Finance & Investment Company Ltd has announced 1:10 stock split, ex-date: 22 Sep 22

Leading Leasing Finance & Investment Company Ltd has announced 1:1 bonus issue, ex-date: 20 Jul 23

No Rights history available
Quality key factors
Valuation key factors
Technicals key factors
 Technical Indicator Scale: Bearish, Mildly Bearish, Sideways, Mildly Bullish, Bullish Turned
 Shareholding Snapshot : Mar 2026
Shareholding Compare (%holding)
Non Institution
None
Held by 0 Schemes
Held by 14 FIIs (48.5%)
None
Al Maha Investment Fund Pcc-onyx Strategy (9.32%)
41.97%
Quarterly Results Snapshot (Standalone) - Mar'26 - YoY

YoY Growth in quarter ended Mar 2026 is 418.22% vs 478.38% in Mar 2025
YoY Growth in quarter ended Mar 2026 is -250.32% vs 995.35% in Mar 2025
Half Yearly Results Snapshot (Standalone) - Sep'25
Growth in half year ended Sep 2025 is 147.71% vs 332.37% in Sep 2024

Growth in half year ended Sep 2025 is 3,048.00% vs -120.66% in Sep 2024
Nine Monthly Results Snapshot (Standalone) - Dec'25
YoY Growth in nine months ended Dec 2025 is 374.44% vs 483.01% in Dec 2024
YoY Growth in nine months ended Dec 2025 is 2,807.37% vs -157.23% in Dec 2024
Annual Results Snapshot (Standalone) - Mar'26
YoY Growth in year ended Mar 2026 is 390.65% vs 481.29% in Mar 2025
YoY Growth in year ended Mar 2026 is 395.74% vs 79.90% in Mar 2025
About Leading Leasing Finance & Investment Company Ltd

Company Coordinates


