
Compare Ceejay Finance with Similar Stocks
Stock DNA
Non Banking Financial Company (NBFC)
INR 62 Cr (Micro Cap)
8.00
21
0.67%
0.62
10.18%
0.81
Total Returns (Price + Dividend) 
Latest dividend: 1.2 per share ex-dividend date: Sep-12-2025
Risk Adjusted Returns v/s
Returns Beta

News

Ceejay Finance Ltd Upgraded to Sell by MarketsMOJO Amid Mixed Technical and Fundamental Signals
Ceejay Finance Ltd, a micro-cap player in the Non Banking Financial Company (NBFC) sector, has seen its investment rating upgraded from Strong Sell to Sell as of 16 July 2026. This change reflects a nuanced shift in the company’s technical outlook amid flat financial performance and valuation considerations, signalling cautious optimism among analysts despite ongoing fundamental challenges.
Read full news article
Ceejay Finance Ltd is Rated Strong Sell
Ceejay Finance Ltd is rated Strong Sell by MarketsMOJO, with this rating last updated on 15 Dec 2025. However, the analysis and financial metrics presented here reflect the stock’s current position as of 10 July 2026, providing investors with an up-to-date view of the company’s fundamentals, valuation, financial trends, and technical outlook.
Read full news article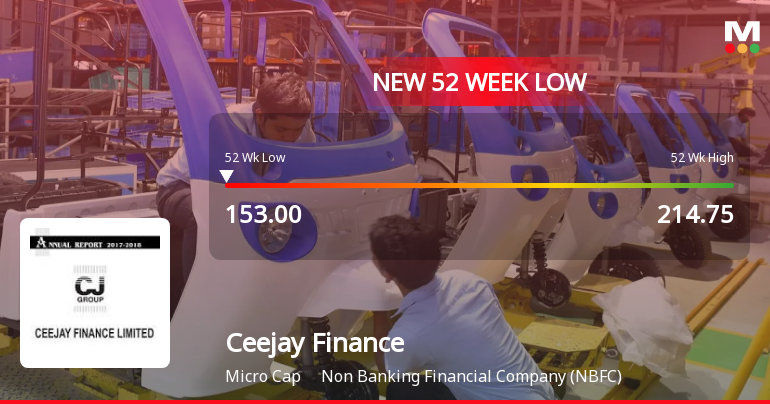
Ceejay Finance Ltd Falls to 52-Week Low of Rs 153 as Sell-Off Deepens
For the second consecutive session, Ceejay Finance Ltd closed lower, slipping to a fresh 52-week low of Rs 153 on 10 Jul 2026. This decline extends the stock’s year-long underperformance, with a 19.47% drop against the Sensex’s more modest 6.83% fall over the same period.
Read full news article Announcements
Compliances-Certificate under Reg. 74 (5) of SEBI (DP) Regulations 2018
13-Jul-2026 | Source : BSERTA Confirmation Certificate for the quarter ended June 30 2026.
Closure of Trading Window
29-Jun-2026 | Source : BSEIntimation for Closure of trading Window for all the designated persons and their immediate relatives from July 01 2026 to till 48 Hours after the announcement of the Financial Results for the Quarter ending June 30 2026.
Compliances-Reg.24(A)-Annual Secretarial Compliance
29-May-2026 | Source : BSEAnnual Secretarial Compliance Report for the financial Year ended on March 31 2026.
Corporate Actions

No Upcoming Board Meetings

Ceejay Finance Ltd has declared 12% dividend, ex-date: 12 Sep 25

No Splits history available

No Bonus history available

No Rights history available
Quality key factors
Valuation key factors
Technicals key factors
 Technical Indicator Scale: Bearish, Mildly Bearish, Sideways, Mildly Bullish, Bullish Turned
 Shareholding Snapshot : Mar 2026
Shareholding Compare (%holding)
Promoters
None
Held by 0 Schemes
Held by 0 FIIs
Harshadbhai Natverlal Dalal Huf (6.02%)
Kimi Business Investments Advisors Llp (4.1%)
21.64%
Quarterly Results Snapshot (Standalone) - Mar'26 - YoY

YoY Growth in quarter ended Mar 2026 is -9.35% vs 25.25% in Mar 2025

YoY Growth in quarter ended Mar 2026 is 32.70% vs -14.52% in Mar 2025
Half Yearly Results Snapshot (Standalone) - Sep'25
Growth in half year ended Sep 2025 is 12.01% vs 20.21% in Sep 2024
Growth in half year ended Sep 2025 is -3.45% vs 20.47% in Sep 2024
Nine Monthly Results Snapshot (Standalone) - Dec'25
YoY Growth in nine months ended Dec 2025 is 5.00% vs 27.70% in Dec 2024
YoY Growth in nine months ended Dec 2025 is 7.69% vs 10.40% in Dec 2024
Annual Results Snapshot (Standalone) - Mar'26
YoY Growth in year ended Mar 2026 is 0.95% vs 26.94% in Mar 2025
YoY Growth in year ended Mar 2026 is 13.53% vs 3.50% in Mar 2025
About Ceejay Finance Ltd

Company Coordinates


