
Compare Ganges Securitie with Similar Stocks
Total Returns (Price + Dividend) 
Ganges Securitie for the last several years.
Risk Adjusted Returns v/s
Returns Beta

News

Ganges Securities Ltd is Rated Strong Sell
Ganges Securities Ltd is rated Strong Sell by MarketsMOJO, with this rating last updated on 25 August 2025. However, the analysis and financial metrics discussed here reflect the stock's current position as of 30 July 2026, providing investors with an up-to-date view of the company’s fundamentals, returns, and market performance.
Read full news article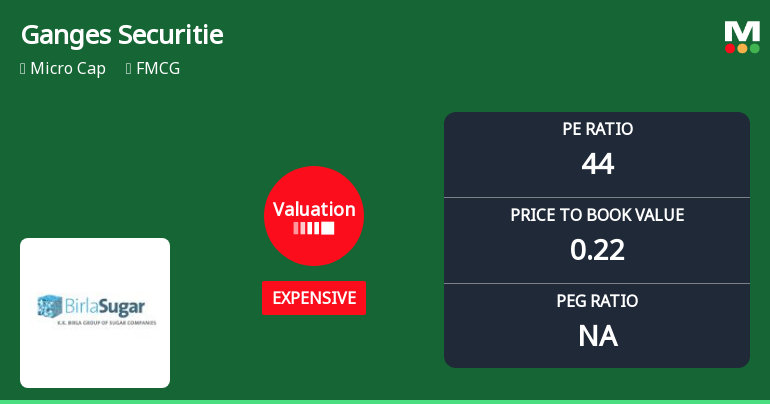
Ganges Securities Ltd Valuation Shifts Signal Elevated Price Risk Amid Weak Returns
Ganges Securities Ltd, a micro-cap player in the FMCG sector, has seen its valuation parameters shift markedly towards the expensive territory, raising concerns about price attractiveness despite subdued financial performance and weak returns. The company’s price-to-earnings (P/E) ratio has surged to 44.25, signalling a premium valuation that contrasts sharply with its modest return on capital employed (ROCE) of 0.69% and return on equity (ROE) of 0.50%.
Read full news article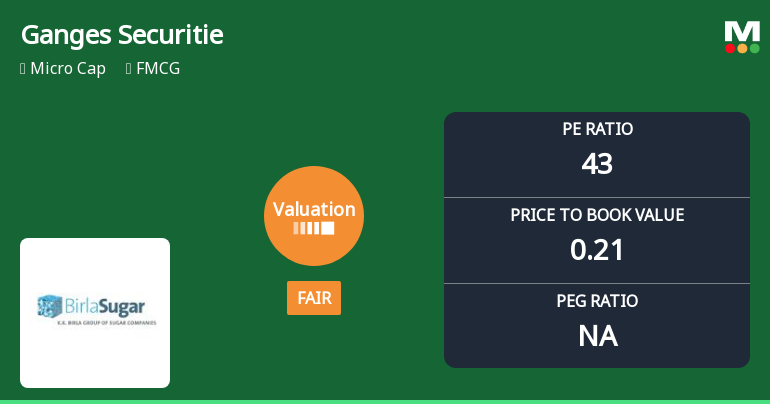
Ganges Securities Ltd Valuation Shifts to Fair Amidst Weak Market Performance
Ganges Securities Ltd, a micro-cap player in the FMCG sector, has seen a notable shift in its valuation parameters, moving from an expensive to a fair rating. Despite this adjustment, the company continues to face significant headwinds, reflected in its deteriorating market performance and weak financial metrics, prompting a downgrade to a Strong Sell rating by MarketsMOJO.
Read full news article Announcements
Announcement under Regulation 30 (LODR)-Newspaper Publication
21-Jul-2026 | Source : BSECopy of newspaper publication
Notice Of 12Th Annual General Meeting
20-Jul-2026 | Source : BSENotice of 12th Annual General Meeting
Reg. 34 (1) Annual Report.
20-Jul-2026 | Source : BSEIn terms of Regulation 34(1) of the SEBI (Listing Obligations and Disclosure Requirements) we enclose a copy of the Annual Report including Audited Financial Statements of the Company for the financial year ended 31st March 2026 together with the Notice dated May 14 2026 convening the 12th Annual General Meeting of the Company on Tuesday August 11 2026. The same is available on the Companys website at www.birla-sugar.com
Corporate Actions

No Upcoming Board Meetings

No Dividend history available

No Splits history available

No Bonus history available

No Rights history available
Quality key factors
Valuation key factors
Technicals key factors
 Technical Indicator Scale: Bearish, Mildly Bearish, Sideways, Mildly Bullish, Bullish Turned
 Shareholding Snapshot : Jun 2026
Shareholding Compare (%holding)
Promoters
None
Held by 1 Schemes (0.01%)
Held by 1 FIIs (0.03%)
Sil Investments Limited (13.38%)
Navjeewan Medical Institute (6.21%)
21.46%
Quarterly Results Snapshot (Consolidated) - Mar'26 - YoY

YoY Growth in quarter ended Mar 2026 is 50.00% vs -24.24% in Mar 2025
YoY Growth in quarter ended Mar 2026 is 26.95% vs 7.48% in Mar 2025
Half Yearly Results Snapshot (Consolidated) - Sep'25

Growth in half year ended Sep 2025 is -4.41% vs 19.10% in Sep 2024
Growth in half year ended Sep 2025 is -52.87% vs 35.93% in Sep 2024
Nine Monthly Results Snapshot (Consolidated) - Dec'25
YoY Growth in nine months ended Dec 2025 is -7.98% vs 11.81% in Dec 2024
YoY Growth in nine months ended Dec 2025 is -41.05% vs 22.30% in Dec 2024
Annual Results Snapshot (Consolidated) - Mar'26
YoY Growth in year ended Mar 2026 is -4.92% vs 9.08% in Mar 2025
YoY Growth in year ended Mar 2026 is -46.84% vs 45.40% in Mar 2025
About Ganges Securities Ltd

Company Coordinates


