
Compare Ganges Securitie with Similar Stocks
Dashboard
With a Operating Losses, the company has a Weak Long Term Fundamental Strength
- Poor long term growth as Operating profit has grown by an annual rate of -16.96%
Flat results in Mar 26
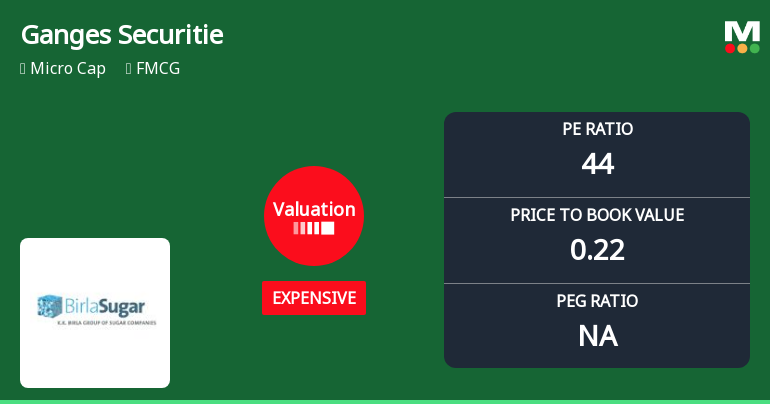
With ROE of 0.5, it has a Expensive valuation with a 0.2 Price to Book Value
Consistent Underperformance against the benchmark over the last 3 years
Total Returns (Price + Dividend) 
Ganges Securitie for the last several years.
Risk Adjusted Returns v/s
Returns Beta

News
Ganges Securities Ltd Valuation Shifts Signal Elevated Price Risk Amid Weak Returns
Ganges Securities Ltd, a micro-cap player in the FMCG sector, has seen its valuation metrics shift notably towards the expensive territory, raising concerns about price attractiveness despite subdued financial performance and underwhelming returns relative to the broader market.
Read full news article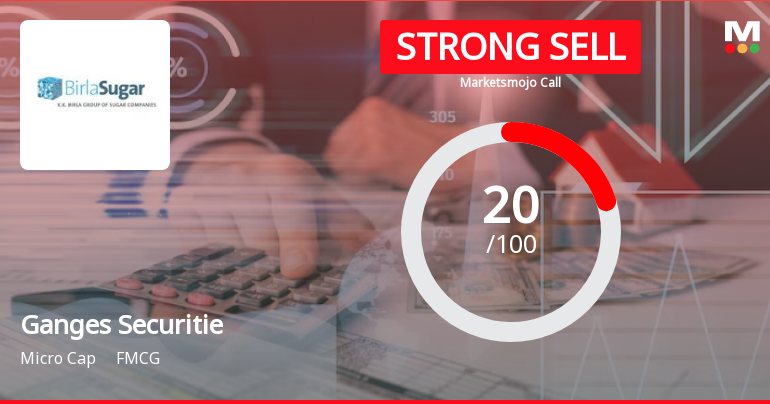
Ganges Securities Ltd is Rated Strong Sell
Ganges Securities Ltd is rated Strong Sell by MarketsMOJO, with this rating last updated on 25 Aug 2025. However, the analysis and financial metrics discussed here reflect the stock’s current position as of 08 July 2026, providing investors with an up-to-date view of the company’s fundamentals, valuation, financial trends, and technical outlook.
Read full news article
Ganges Securities Ltd Valuation Shifts Signal Price Attractiveness Concerns
Ganges Securities Ltd, operating within the FMCG sector, has experienced a notable shift in its valuation parameters, moving from a 'very expensive' to an 'expensive' rating. Despite this adjustment, the company’s price-to-earnings (P/E) ratio remains elevated at 45.56, signalling continued premium pricing relative to peers and historical averages. This article analyses the implications of these valuation changes, contrasting them with sector benchmarks and peer companies, while considering the broader market context and company fundamentals.
Read full news article Announcements
Announcement under Regulation 30 (LODR)-Newspaper Publication
17-Jul-2026 | Source : BSECopy of newspaper publication
Compliances-Certificate under Reg. 74 (5) of SEBI (DP) Regulations 2018
13-Jul-2026 | Source : BSECertificate under SEBI (Depositories and Participants) Regulations 2018
Closure of Trading Window
27-Jun-2026 | Source : BSEClosure of Trading Window
Corporate Actions

No Upcoming Board Meetings

No Dividend history available

No Splits history available

No Bonus history available

No Rights history available
Quality key factors
Valuation key factors
Technicals key factors
 Technical Indicator Scale: Bearish, Mildly Bearish, Sideways, Mildly Bullish, Bullish Turned
 Shareholding Snapshot : Mar 2026
Shareholding Compare (%holding)
Promoters
None
Held by 1 Schemes (0.01%)
Held by 1 FIIs (0.03%)
Sil Investments Limited (13.38%)
Navjeewan Medical Institute (6.21%)
21.69%
Quarterly Results Snapshot (Consolidated) - Mar'26 - YoY

YoY Growth in quarter ended Mar 2026 is 50.00% vs -24.24% in Mar 2025
YoY Growth in quarter ended Mar 2026 is 26.95% vs 7.48% in Mar 2025
Half Yearly Results Snapshot (Consolidated) - Sep'25

Growth in half year ended Sep 2025 is -4.41% vs 19.10% in Sep 2024
Growth in half year ended Sep 2025 is -52.87% vs 35.93% in Sep 2024
Nine Monthly Results Snapshot (Consolidated) - Dec'25
YoY Growth in nine months ended Dec 2025 is -7.98% vs 11.81% in Dec 2024
YoY Growth in nine months ended Dec 2025 is -41.05% vs 22.30% in Dec 2024
Annual Results Snapshot (Consolidated) - Mar'26
YoY Growth in year ended Mar 2026 is -4.92% vs 9.08% in Mar 2025
YoY Growth in year ended Mar 2026 is -46.84% vs 45.40% in Mar 2025
About Ganges Securities Ltd

Company Coordinates


