
Compare Indian Energy Ex with Similar Stocks
Dashboard
Poor long term growth as Net Sales has grown by an annual rate of 14.14% and Operating profit at 16.24% over the last 5 years
Flat results in Mar 26
With ROE of 36.1, it has a Very Expensive valuation with a 8.1 Price to Book Value
Below par performance in long term as well as near term
Stock DNA
Capital Markets
INR 11,079 Cr (Small Cap)
22.00
25
2.83%
-1.31
36.12%
8.07
Total Returns (Price + Dividend) 
Latest dividend: 2 per share ex-dividend date: May-15-2026
Risk Adjusted Returns v/s
Returns Beta

News
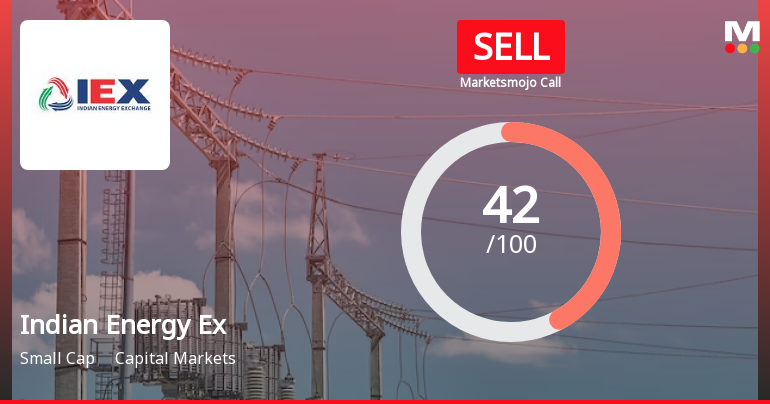
Indian Energy Exchange Ltd is Rated Sell
Indian Energy Exchange Ltd is rated 'Sell' by MarketsMOJO, with this rating last updated on 18 Aug 2025. However, the analysis and financial metrics discussed here reflect the stock's current position as of 05 July 2026, providing investors with an up-to-date perspective on the company’s fundamentals, valuation, financial trends, and technical outlook.
Read full news article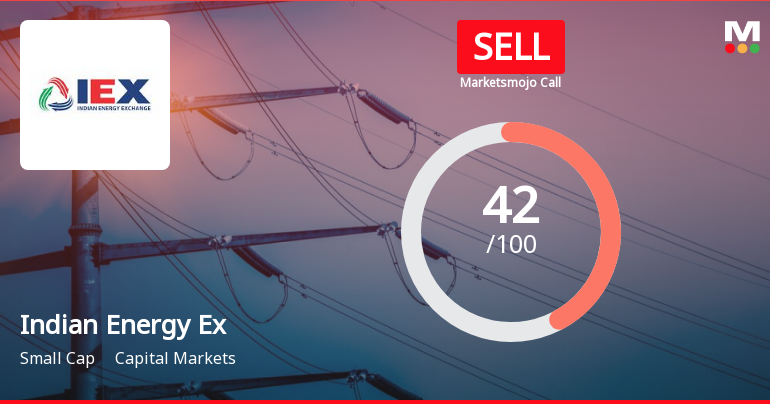
Indian Energy Exchange Ltd is Rated Sell
Indian Energy Exchange Ltd is rated 'Sell' by MarketsMOJO, with this rating last updated on 18 Aug 2025. However, the analysis and financial metrics discussed here reflect the stock's current position as of 24 June 2026, providing investors with an up-to-date perspective on the company’s performance and outlook.
Read full news article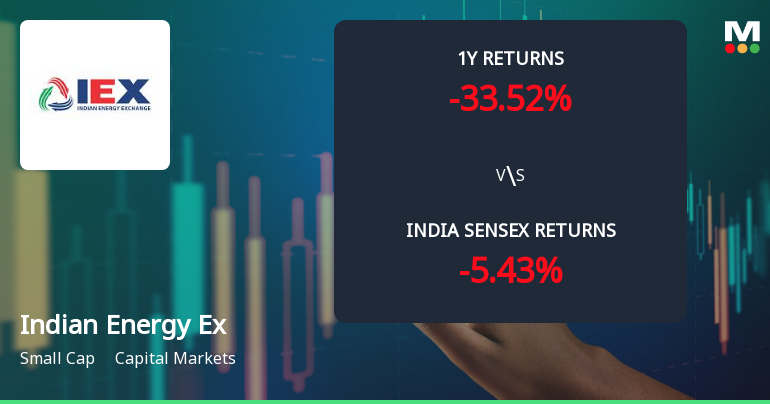
Indian Energy Exchange Ltd Technical Momentum Shifts Amid Mixed Market Signals
Indian Energy Exchange Ltd (IEX) has experienced a nuanced shift in its technical momentum, reflecting a complex interplay of bullish and bearish signals across multiple timeframes. Despite a modest day gain of 0.53%, the stock’s technical indicators reveal a transition from a predominantly bearish stance to a mildly bearish outlook, prompting a reassessment of its near-term trajectory within the capital markets sector.
Read full news article Announcements
Announcement under Regulation 30 (LODR)-Press Release / Media Release
03-Jul-2026 | Source : BSEIEX Power Market Update Q1 FY27 and June26.
Closure of Trading Window
23-Jun-2026 | Source : BSEClosure of Trading Window for declaration of unaudited Financial Results for the quarter ending June 30 2026.
Announcement under Regulation 30 (LODR)-Analyst / Investor Meet - Intimation
23-Jun-2026 | Source : BSESchedule of Investor Meeting as on June 23 2026.
Corporate Actions

No Upcoming Board Meetings

Indian Energy Exchange Ltd has declared 200% dividend, ex-date: 15 May 26

Indian Energy Exchange Ltd has announced 1:10 stock split, ex-date: 19 Oct 18

Indian Energy Exchange Ltd has announced 2:1 bonus issue, ex-date: 03 Dec 21

No Rights history available
Quality key factors
Valuation key factors
Technicals key factors
 Technical Indicator Scale: Bearish, Mildly Bearish, Sideways, Mildly Bullish, Bullish Turned
 Shareholding Snapshot : Mar 2026
Shareholding Compare (%holding)
Non Institution
None
Held by 26 Schemes (22.09%)
Held by 168 FIIs (14.16%)
None
Parag Parikh Mutual Fund Under Its Various Schemes (9.5%)
36.93%
Quarterly Results Snapshot (Consolidated) - Mar'26 - YoY

YoY Growth in quarter ended Mar 2026 is 22.53% vs 17.29% in Mar 2025

YoY Growth in quarter ended Mar 2026 is 10.81% vs 21.12% in Mar 2025
Half Yearly Results Snapshot (Consolidated) - Sep'25
Growth in half year ended Sep 2025 is 12.44% vs 23.71% in Sep 2024
Growth in half year ended Sep 2025 is 19.18% vs 26.17% in Sep 2024
Nine Monthly Results Snapshot (Consolidated) - Dec'25
YoY Growth in nine months ended Dec 2025 is 11.73% vs 20.48% in Dec 2024
YoY Growth in nine months ended Dec 2025 is 16.38% vs 22.81% in Dec 2024
Annual Results Snapshot (Consolidated) - Mar'26
YoY Growth in year ended Mar 2026 is 14.59% vs 19.62% in Mar 2025
YoY Growth in year ended Mar 2026 is 14.85% vs 22.35% in Mar 2025
About Indian Energy Exchange Ltd

Company Coordinates


