
Compare IFGL Refractori. with Similar Stocks
Dashboard
Company has a Debt to Equity ratio (avg) of 0.02 times
Poor long term growth as Operating profit has grown by an annual rate -11.98% of over the last 5 years
Positive results in Mar 26
With ROE of 3.4, it has a Fair valuation with a 1.2 Price to Book Value
Majority shareholders : Promoters
Underperformed the market in the last 1 year
Stock DNA
Electrodes & Refractories
INR 1,400 Cr (Small Cap)
35.00
38
0.00%
0.07
3.39%
1.18
Total Returns (Price + Dividend) 
Latest dividend: 0.5 per share ex-dividend date: Jun-06-2025
Risk Adjusted Returns v/s
Returns Beta

News

IFGL Refractories Ltd Upgraded to Hold as Technicals Improve and Financials Show Strength
IFGL Refractories Ltd has seen its investment rating upgraded from Sell to Hold, reflecting a nuanced improvement across technical indicators, valuation metrics, financial trends, and overall quality. This shift comes amid a backdrop of mixed performance, with recent quarterly results showing promise despite longer-term challenges in growth and market returns.
Read full news article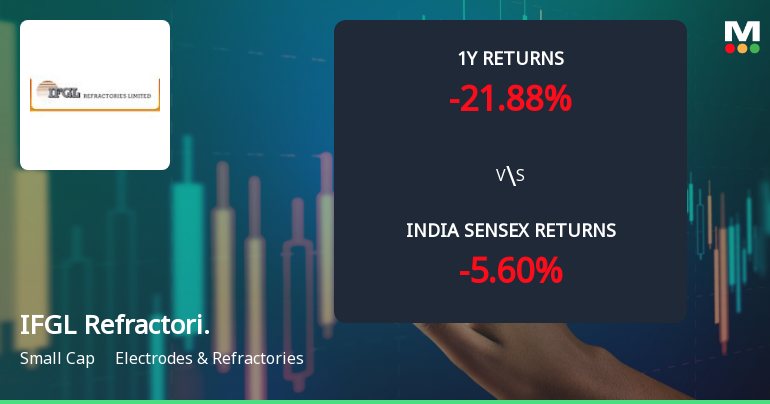
IFGL Refractories Ltd Technical Momentum Shifts Amid Mixed Market Signals
IFGL Refractories Ltd, a small-cap player in the Electrodes & Refractories sector, has experienced a notable shift in its technical momentum, moving from a mildly bearish stance to a more sideways trend. This change is underscored by a complex interplay of technical indicators, including MACD, RSI, moving averages, and Bollinger Bands, signalling a nuanced outlook for investors as the stock navigates volatile market conditions.
Read full news article
IFGL Refractories Ltd is Rated Sell
IFGL Refractories Ltd is rated Sell by MarketsMOJO. This rating was last updated on 08 June 2026. However, the analysis and financial metrics discussed below reflect the stock's current position as of 15 June 2026, providing investors with the most up-to-date view of the company’s fundamentals, returns, and market performance.
Read full news article Announcements
Disclosure Under Regulation 30 Of The SEBI (Listing Obligations And Disclosure Requirements) Regulations 2015 (SEBI LODR 2015)
17-Jun-2026 | Source : BSEFollowing Companys earlier Notices dated 10th October 2024 14th October 2024 24th December 2024 and 23rd April 2025 in relation to Company entering into a Joint Venture Agreement on 14th October 2024 with Marvels International Group Co Ltd of Seychelles and Marvel Refractories (Anshan) Company Ltd of P R China (hereon Marvels Group) for setting up green field Project for manufacture of (a) Basic Fired Magnesite Spinel Bricks (b) Basic Fired Magnesite Bricks and (c) Fired Magnesia Chrome Bricks for Cement Glass Non-Ferrous and Gasification Industries and matters associated therewith through a Joint Venture Company. Notice is hereby given that an application for approval pursuant to Press Note 3 of Government of India (hereon GOI) was made to appropriate Authority of GOI which expressed concern with location of the Project being Bhachau (Gujarat).
Announcement under Regulation 30 (LODR)-Newspaper Publication
17-Jun-2026 | Source : BSEPlease find enclosed herewith copies of Notice published in newspapers Business Standard - All Editions and Pratidin - Odiya Newspaper on Wednesday 17th June 2026 pursuant to provisions of Sections 108 and 110 of the Companies Act 2013 Rules 20 and 22 of the Companies (Management and Administration) Rules 2014 and applicable Circulars issued by Ministry of Corporate Affairs from time to time with regard to dispatch of Postal Ballot Notice issued by the Company. Copy of said publications are also being hosted on Companys Website: https://ifglgroup.com/ and is available at link https://ifglgroup.com/investor/postal-ballot/ .
Shareholder Meeting / Postal Ballot-Notice of Postal Ballot
16-Jun-2026 | Source : BSEPlease find enclosed herewith Postal Ballot Notice dated 13th June 2026 (hereon Notice) issued by the Company for approval of the Members by passing of Ordinary Resolution through Postal Ballot by way of remote e-voting process for appointment of Mr Mukesh Harshadrai Rawal (DIN : 11676514) who was appointed as an Additional Director of the Company on and from Tuesday 21st April 2026 by the Board of Directors of the Company as per provisions of Section 161(1) of the Companies Act 2013 and who being eligible has offered himself for appointment as Non-Executive Non-Independent Director of the Company liable to retire by rotation on and from 17th July 2026 being the last date of e-voting pursuant to related Postal Ballot Notice.
Corporate Actions

No Upcoming Board Meetings

IFGL Refractories Ltd has declared 21% dividend, ex-date: 29 Jul 26

No Splits history available

IFGL Refractories Ltd has announced 1:1 bonus issue, ex-date: 18 Jul 25

No Rights history available
Quality key factors
Valuation key factors
Technicals key factors
 Technical Indicator Scale: Bearish, Mildly Bearish, Sideways, Mildly Bullish, Bullish Turned
 Shareholding Snapshot : Mar 2026
Shareholding Compare (%holding)
Promoters
None
Held by 5 Schemes (13.16%)
Held by 9 FIIs (0.03%)
Bajoria Financial Services Private Limited (67.32%)
Hdfc Small Cap Fund (9.09%)
10.97%
Quarterly Results Snapshot (Consolidated) - Mar'26 - YoY

YoY Growth in quarter ended Mar 2026 is 7.68% vs 13.86% in Mar 2025

YoY Growth in quarter ended Mar 2026 is 69.40% vs -32.78% in Mar 2025
Half Yearly Results Snapshot (Consolidated) - Sep'25
Growth in half year ended Sep 2025 is 14.17% vs -6.11% in Sep 2024
Growth in half year ended Sep 2025 is -36.02% vs -45.67% in Sep 2024
Nine Monthly Results Snapshot (Consolidated) - Dec'25
YoY Growth in nine months ended Dec 2025 is 17.17% vs -3.30% in Dec 2024
YoY Growth in nine months ended Dec 2025 is -40.90% vs -50.02% in Dec 2024
Annual Results Snapshot (Consolidated) - Mar'26
YoY Growth in year ended Mar 2026 is 14.59% vs 0.83% in Mar 2025
YoY Growth in year ended Mar 2026 is -19.26% vs -47.37% in Mar 2025
About IFGL Refractories Ltd

Company Coordinates


