
Compare Praxis Home with Similar Stocks
Dashboard
With a Operating Losses, the company has a Weak Long Term Fundamental Strength
- Poor long term growth as Net Sales has grown by an annual rate of -21.11% over the last 5 years
- High Debt Company with a Debt to Equity ratio (avg) of 59.01 times
The company has declared Negative results for the last 15 consecutive quarters
Risky - Negative EBITDA
Consistent Underperformance against the benchmark over the last 3 years
Stock DNA
Garments & Apparels
INR 146 Cr (Micro Cap)
NA (Loss Making)
NA
0.00%
2.38
-118.05%
2.94
Total Returns (Price + Dividend) 
Praxis Home for the last several years.
Risk Adjusted Returns v/s
Returns Beta

News

Praxis Home Retail Ltd Locks at Upper Circuit With 4.9% Gain — Buyers Queue, Sellers Absent
At Rs 8.49, the buying was done — not because demand dried up, but because the exchange wouldn't let the stock go any higher. Praxis Home Retail Ltd locked at its upper circuit of 4.94% on 22 Jun 2026, with buyers queuing and no sellers willing to part with shares.
Read full news article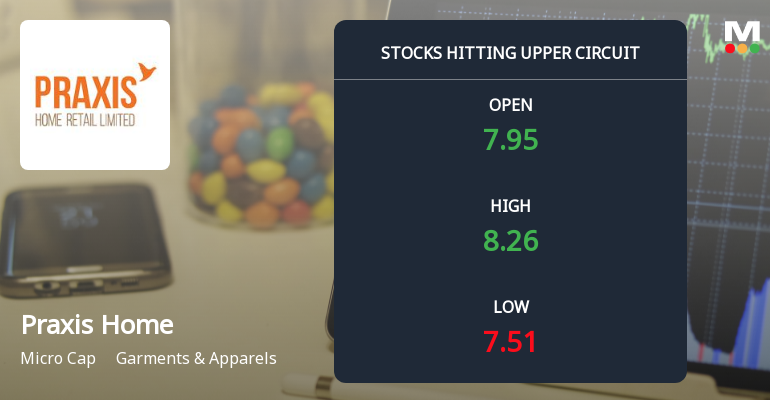
Praxis Home Retail Ltd Locks at Upper Circuit With 4.97% Gain — Buyers Queue, Sellers Absent
At Rs 8.24, the buying was done — not because demand dried up, but because the exchange wouldn't let the stock go any higher. Praxis Home Retail Ltd locked at its upper circuit of 4.97% on 16 Jun 2026, with buyers queuing and no sellers willing to part with shares.
Read full news article
Praxis Home Retail Ltd is Rated Strong Sell
Praxis Home Retail Ltd is rated Strong Sell by MarketsMOJO, with this rating last updated on 12 Nov 2024. However, the analysis below reflects the stock’s current position as of 16 June 2026, incorporating the latest fundamentals, returns, and financial metrics to provide investors with a comprehensive view of the company’s standing today.
Read full news article Announcements
Announcement under Regulation 30 (LODR)-Change in Management
12-Jun-2026 | Source : BSEAppointment of Mr. Rahul Gambhir and Mr. Chetranda Somanna Muddaiah as Additional Independent Directors of the Company w.e.f. June 13 2026.
Announcement under Regulation 30 (LODR)-Newspaper Publication
31-May-2026 | Source : BSENewspaper publication of Audited Financial Results for the Quarter and Year ended March 31 2026.
Board Meeting Outcome for Outcome Of The Board Meeting
29-May-2026 | Source : BSEOutcome of the Board Meeting
Corporate Actions

No Upcoming Board Meetings

No Dividend history available

No Splits history available

No Bonus history available

Praxis Home Retail Ltd has announced 11:30 rights issue, ex-date: 20 Mar 25
Quality key factors
Valuation key factors
Technicals key factors
 Technical Indicator Scale: Bearish, Mildly Bearish, Sideways, Mildly Bullish, Bullish Turned
 Shareholding Snapshot : Mar 2026
Shareholding Compare (%holding)
Non Institution
None
Held by 1 Schemes (0.0%)
Held by 2 FIIs (1.37%)
Surplus Finvest Private Limited (3.24%)
Elimath Advisors Private Limited (12.85%)
48.27%
Quarterly Results Snapshot (Standalone) - Mar'26 - YoY

YoY Growth in quarter ended Mar 2026 is -9.04% vs -41.10% in Mar 2025

YoY Growth in quarter ended Mar 2026 is -701.25% vs 57.06% in Mar 2025
Half Yearly Results Snapshot (Standalone) - Sep'25
Growth in half year ended Sep 2025 is -22.64% vs -47.14% in Sep 2024
Growth in half year ended Sep 2025 is 626.67% vs 63.57% in Sep 2024
Nine Monthly Results Snapshot (Standalone) - Dec'25
YoY Growth in nine months ended Dec 2025 is -22.72% vs -47.08% in Dec 2024
YoY Growth in nine months ended Dec 2025 is 336.43% vs 60.56% in Dec 2024
Annual Results Snapshot (Standalone) - Mar'26
YoY Growth in year ended Mar 2026 is -19.59% vs -45.82% in Mar 2025
YoY Growth in year ended Mar 2026 is -90.42% vs 59.19% in Mar 2025
About Praxis Home Retail Ltd

Company Coordinates


