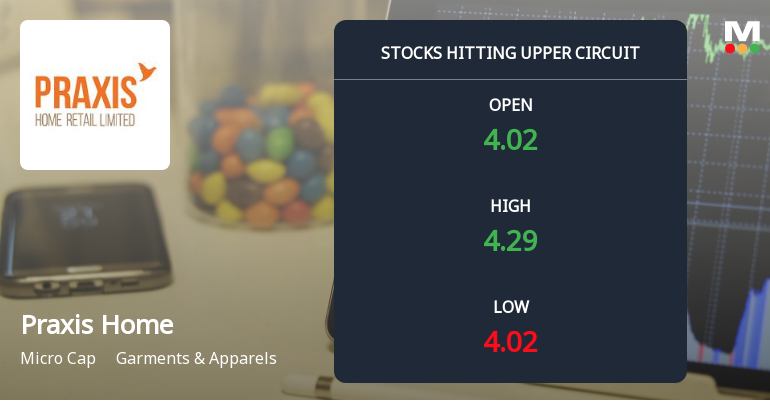
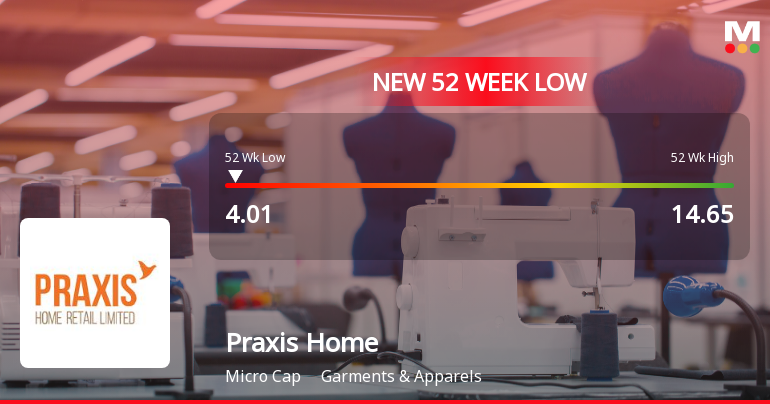
Praxis Home

  • Market Cap: Micro Cap
  • Industry: Garments & Apparels
  • ISIN: INE546Y01022
  • NSEID: PRAXIS
  • BSEID: 540901
INR
4.24
0.09 (2.17%)
BSENSE

Sep 21, 03:30 PM

BSE+NSE Vol: 1.12 lacs

  • Price Points
  • Score
  • Mojo Parameters
  • Total Return
  • News and Corporate Actions
  • Key factors
  • Shareholding
  • Financials
  • CompanyCV
stock-summaryPrice Point
High/Low

1Day

52 Week

Valuation
Technical
Day's Volume

CASH

1.12 lacs (-8.66%) Volume

Shareholding (Jun 2026)

FII

1.37%

Held by 2 FIIs

DII

0.26%

Held by 1 DIIs

Promoter

7.23%

Why is Praxis Home Retail Ltd falling/rising?

06-Sep-2026

As of 05-Sep, Praxis Home Retail Ltd's stock is rising to 4.68, a 4.7% increase after a trend reversal. However, it has seen significant long-term declines and faces financial challenges, leading to a classification as a strong sell.

As of 05-Sep, Praxis Home Retail Ltd's stock price is rising, currently at 4.68, reflecting a change of 0.21 or 4.7% increase. This upward movement comes after a trend reversal, as the stock has gained after nine consecutive days of decline. Additionally, it has outperformed its sector by 4.76% today. <BR><BR>However, it is important to note that despite this short-term rise, the stock has experienced significant declines over longer periods, including a 28.33% drop over the past month and a staggering 65.38% decrease over the last year. The stock is also trading below its moving averages across various time frames, indicating a generally bearish trend. <BR><BR>Investor participation has fallen sharply, with delivery volume dropping by 73.05% compared to the five-day average, suggesting a lack of confidence among investors. Furthermore, the company is facing serious financial challenges, including operating losses and a high debt-to-equity ratio, which contribute to its classification as a strong sell. <BR><BR>In summary, while the stock is currently rising, this is against a backdrop of significant long-term underperformance and financial instability.

View full answer

Who are in the management team of Praxis Home?

01-Sep-2026

The management team of Praxis Home includes Viraj Didwania (Chairman & Managing Director), Shrirang Kisanlal Sarda (Director), and several Independent Directors, along with additional directors and a Company Secretary, bringing diverse expertise to the company's governance.

The management team of Praxis Home includes the following individuals:<BR><BR>1. **Viraj Didwania** - Chairman & Managing Director<BR>2. **Shrirang Kisanlal Sarda** - Director<BR>3. **Pankaj Bhargava** - Independent Director<BR>4. **Shantanu Shah** - Independent Director<BR>5. **S Subramanian** - Independent Director<BR>6. **Sridevi Badiga** - Independent Director<BR>7. **Smita Chowdhury** - Company Secretary<BR>8. **Avni Biyani** - Additional Director<BR>9. **Harminder Sahni** - Additional Director<BR>10. **Jacob Mathew** - Additional Director<BR>11. **Mahesh Shah** - Managing Director & Additional Director<BR>12. **Anou Singhvi** - Additional Director<BR>13. **Lynette Robert Monteiro** - Additional Director<BR><BR>This diverse team brings a range of expertise to the company, contributing to its strategic direction and governance.

View full answer

What does Praxis Home do?

01-Sep-2026

Praxis Home Retail Ltd operates in the Garments & Apparels industry as a Micro Cap company, reporting net sales of 27 Cr and a net loss of 11 Cr for June 2026. The company has a market cap of INR 92 Cr and significant debt, with a debt-equity ratio of 2.38.

Overview:<BR>Praxis Home Retail Ltd operates in the Garments & Apparels industry and is categorized as a Micro Cap company.<BR><BR>History:<BR>The company was originally incorporated on January 31, 2011, as GRN Energy Private Limited. It underwent several name changes, becoming GRN Retail Private Limited on December 21, 2016, and then Praxis Home Retail Private Limited on January 5, 2017. It became a Public Company in the fiscal year 2017-18. The latest quarterly results reported net sales and net profit for June 2026.<BR><BR>Financial Snapshot:<BR>- Most recent Net Sales: 27 Cr (Quarterly Results - Jun 2026)<BR>- Most recent Net Profit: -11 Cr (Quarterly Results - Jun 2026)<BR>- Market-cap value: INR 92 Cr (Micro Cap)<BR><BR>Key Metrics:<BR>- P/E: N/A (Loss Making)<BR>- Industry P/E: 67<BR>- Dividend Yield: 0.00%<BR>- Debt-Equity: 2.38<BR>- Return on Equity: -107.58%<BR>- Price to Book: 1.79<BR><BR>Contact Details:<BR>- Address: iThink Techno Campus Jolly, Board Tower D Kanjumarg(East) Mumbai Maharashtra : 400042<BR>- Phone: 91-22-71068031<BR>- Email: investorrelations@praxisretail.in<BR>- Website: http://www.praxisretail.in

View full answer

Who are the peers of the Praxis Home?

01-Sep-2026

Praxis Home's peers include Gravity (India), Parmeshwari Silk, Acknit Indus., and others. Management risk is generally below average for Praxis Home and several peers, with Gravity (India) showing the highest 1-year return at 123.52%, while Praxis Home's return is -66.19%.

Peers: The peers of Praxis Home are Gravity (India), Parmeshwari Silk, Acknit Indus., Addi Industries, Rachit Prints, SEL Mfg. Co, Anand Rayons, KG Petrochem, Sanrhea Tech, and Globe Enterprise.<BR><BR>Quality Snapshot: Excellent management risk is observed at Rachit Prints and Sanrhea Tech, while Average management risk is found at Parmeshwari Silk, Acknit Indus., and the rest. Below Average management risk is noted for Gravity (India), Addi Industries, SEL Mfg. Co, Anand Rayons, KG Petrochem, and Praxis Home. Growth is Excellent at Gravity (India), Good at Rachit Prints and Sanrhea Tech, Average at Anand Rayons, and Below Average at Parmeshwari Silk, Acknit Indus., Addi Industries, SEL Mfg. Co, KG Petrochem, and Praxis Home. Capital Structure is Good at Rachit Prints and Sanrhea Tech, Average at Anand Rayons, and Below Average at Gravity (India), Parmeshwari Silk, Acknit Indus., Addi Industries, SEL Mfg. Co, KG Petrochem, and Praxis Home.<BR><BR>Return Snapshot: Gravity (India) has the highest 1-year return at 123.52%, while Anand Rayons has the lowest at -85.84%. Praxis Home's 1-year return of -66.19% is better than Anand Rayons but worse than Gravity (India). Additionally, the six-month returns are negative for Anand Rayons, Praxis Home, KG Petrochem, and SEL Mfg. Co.

View full answer

How big is Praxis Home?

01-Sep-2026

As of 31st August, Praxis Home Retail Ltd has a market capitalization of 92.00 Cr and reported net sales of 98.76 Cr with a net loss of 61.21 Cr over the last four quarters.

As of 31st August, <BR><BR>Market Cap: Praxis Home Retail Ltd has a market capitalization of 92.00 Cr, categorized as a Micro Cap.<BR><BR>Recent Quarterly Performance: The sum of Net Sales for the latest 4 quarters is 98.76 Cr, while the sum of Net Profit for the same period reflects a loss of 61.21 Cr.<BR><BR>Balance Sheet Snapshot: The reporting period for the balance sheet is March 2025. Shareholder's Funds are recorded at a loss of 61.49 Cr, and Total Assets amount to 313.37 Cr.

View full answer

Should I buy, sell or hold Praxis Home Retail Ltd?

08-Aug-2026

Are Praxis Home Retail Ltd latest results good or bad?

07-Aug-2026

Praxis Home Retail Ltd's latest results are concerning, showing a net loss of ₹115.30 crores in Q4 FY26, a 700.76% increase in losses, and a significant decline in revenue. The company faces severe financial distress, with negative operating margins and a 46.81% drop in stock value over the past year.

Praxis Home Retail Ltd's latest results are quite concerning and reflect a significant decline in financial performance. In Q4 FY26, the company reported a net loss of ₹115.30 crores, which is a staggering 700.76% increase in losses compared to the previous quarter. Revenue also fell to ₹24.74 crores, marking a 9.04% decrease year-on-year and a 5.57% decline quarter-on-quarter.<BR><BR>The operating margin is deeply negative at -35.13%, indicating that the company is struggling to manage its costs effectively. Furthermore, the company has been facing ongoing challenges, as evidenced by a five-year sales growth rate of -23.41%, and it has not generated positive cash flows from operations for two consecutive years.<BR><BR>The stock has also underperformed significantly, with a one-year decline of 46.81%, compared to the broader market's decline of 8.40%. This performance, combined with negative shareholder equity and an alarming reduction in promoter holdings, suggests that the company is in a precarious financial position.<BR><BR>Overall, the latest results indicate that Praxis Home Retail is in severe distress, and the outlook appears bleak without a credible turnaround plan.

View full answer

When is the next results date for Praxis Home Retail Ltd?

04-Aug-2026

The next results date for Praxis Home Retail Ltd is August 7, 2026.

The next results date for Praxis Home Retail Ltd is scheduled for August 7, 2026.

View full answer

How has been the historical performance of Praxis Home?

15-Nov-2025

Praxis Home has experienced a significant decline in net sales and profitability, with net sales dropping from 702.77 crore in March 2020 to 118.97 crore in March 2025, and negative operating profits and shareholder equity by March 2025. The company's financial struggles are evident in its ongoing operational challenges and deteriorating financial position.

Answer:<BR>The historical performance of Praxis Home shows a significant decline in net sales and profitability over the years, culminating in a challenging financial position by March 2025.<BR><BR>Breakdown:<BR>Praxis Home's net sales have decreased dramatically from 702.77 crore in March 2020 to just 118.97 crore in March 2025. This decline reflects a consistent downward trend in total operating income, which fell from 682.81 crore in March 2019 to 118.97 crore in March 2025. The company's operating profit has also been negative for several years, with an operating profit of -29.96 crore in March 2025, compared to a profit of 15.29 crore in March 2020. Profit before tax has worsened, moving from -26.10 crore in March 2019 to -34.98 crore in March 2025. The profit after tax followed a similar trajectory, ending at -34.98 crore in March 2025, down from a profit of 14.24 crore in March 2022. The company's total liabilities have remained relatively stable, with a slight decrease from 319.23 crore in March 2024 to 313.37 crore in March 2025. However, shareholder's funds have turned negative, indicating a deteriorating equity position, with -61.49 crore reported in March 2025. Cash flow from operating activities has also been negative, reflecting ongoing operational challenges, with -27.00 crore in March 2025. Overall, Praxis Home's financial performance indicates significant struggles, particularly in revenue generation and profitability.

View full answer

Is Praxis Home overvalued or undervalued?

09-Jun-2025

As of December 28, 2020, Praxis Home Retail Ltd. is considered overvalued and risky, with concerning financial metrics such as a PE ratio of -6.92 and an EV to EBITDA of -15.25, alongside significant underperformance compared to the Sensex.

As of 28 December 2020, the valuation grade for Praxis Home Retail Ltd. moved from does not qualify to risky, indicating a significant change in its perceived financial stability. The company appears to be overvalued based on its current metrics, with a PE ratio of -6.92, an EV to EBITDA of -15.25, and a ROCE of -44.17%. These ratios suggest that the company is struggling to generate positive earnings and returns on capital.<BR><BR>When compared to its peers, Praxis Home's valuation metrics are concerning. For instance, its PE ratio is significantly lower than the industry average, and its EV to EBITDA ratio also reflects a negative outlook. Notably, the company has underperformed the Sensex over various time frames, with a year-to-date return of -30.08% compared to the Sensex's 5.56%. Overall, these factors reinforce the conclusion that Praxis Home is overvalued in the current market environment.

View full answer

What is the technical trend for Praxis Home?

09-Jun-2025

As of May 15, 2025, Praxis Home's technical trend is mildly bearish, with mixed signals from indicators like the weekly MACD being mildly bullish and the monthly MACD remaining bearish.

As of 15 May 2025, the technical trend for Praxis Home has changed from bearish to mildly bearish. The weekly MACD indicates a mildly bullish stance, while the monthly MACD remains bearish. The daily moving averages are mildly bearish, suggesting short-term weakness. The Bollinger Bands show a bullish signal on the weekly chart but a mildly bearish signal on the monthly chart. The KST is mildly bullish weekly but bearish monthly. Overall, the current technical stance is mildly bearish, with key indicators such as the daily moving averages and monthly MACD contributing to this view.

View full answer

Who are the top shareholders of the Praxis Home?

06-Jun-2025

The top shareholders of Praxis Home include Surplus Finvest Private Limited with 18.14%, Mathew Cyriac as the largest public shareholder at 7.41%, and individual investors holding 43.17%. There are no pledged promoter holdings, and four foreign institutional investors hold a combined 1.89%.

The top shareholders of Praxis Home include Surplus Finvest Private Limited, which holds the largest stake at 18.14%. Following that, Mathew Cyriac is the highest public shareholder with a holding of 7.41%. Additionally, individual investors collectively own 43.17% of the company. The company does not have any pledged promoter holdings, and there are four foreign institutional investors (FIIs) with a combined holding of 1.89%.

View full answer

Has Praxis Home declared dividend?

06-Jun-2025

No Dividend History Available

iScoreScore
Click here to find our call on this stock
Strong Sell
Sell
Hold
Buy
Strong Buy

Dashboard

1

With a Negative Book Value, the company has a Weak Long Term Fundamental Strength

  • Poor long term growth as Net Sales has grown by an annual rate of -21.82% over the last 5 years
  • The company has a negative book value of Rs 77.15 crore
2

Flat results in Jun 26

3

Risky - Negative EBITDA

4

Consistent Underperformance against the benchmark over the last 3 years

stock-summaryMojo Parameters

Mojo Parameters

Loading Valuation Snapshot...

Stock DNA

stock-summary
Industry

Garments & Apparels

stock-summary
Market cap

INR 79 Cr (Micro Cap)

stock-summary
P/E

NA (Loss Making)

stock-summary
Industry P/E

65

stock-summary
Dividend Yield

0.00%

stock-summary
Debt Equity

-0.58

stock-summary
Return on Equity

72.08%

stock-summary
Price to Book

-0.99

Revenue and Profits:
Net Sales:
27 Cr
(Quarterly Results - Jun 2026)
Net Profit:
-11 Cr
stock-summaryTotal Returns
Total Returns (Price + Dividend) stock-summary
Dividend Yield (0%)
TimePeriod
Price Return
Dividend Return
Total Return
3 Months
-48.1%
0%
-48.1%
6 Months
-34.77%
0%
-34.77%
1 Year
-66.82%
0%
-66.82%
2 Years
-81.2%
0%
-81.2%
3 Years
-84.34%
0%
-84.34%
4 Years
-82.21%
0%
-82.21%
5 Years
-82.06%
0%
-82.06%

Praxis Home for the last several years.

Risk Adjusted Returns v/s stock-summary
Returns Beta
Icon
Beta has not been calculated since enough price history is not available
stock-summaryNews & Corporate Actions

News

Announcements stock-summary

Board Meeting Outcome for Outcome Of Board Meeting Held On September 11 2026.

11-Sep-2026 | Source : BSE

Praxis Home Retail has informed the exchange that Board of Directors have approved proposal of Rights issue at its meeting held on September 11 2026.

Announcement Under Regulation 30 (LODR)

09-Sep-2026 | Source : BSE

Announcement under Regulation 30 (LODR)

Board Meeting Intimation for Taking Approval Of Raising Funds By Way Of Issuance Of Equity Shares Of The Company On A Rights Issue Basis.

07-Sep-2026 | Source : BSE

Praxis Home Retail Ltdhas informed BSE that the meeting of the Board of Directors of the Company is scheduled on 11/09/2026 inter alia to consider and approve the proposal for raising of funds by way of issuance of equity shares on Rights Issue basis.

Corporate Actions stock-summary

stock-summary
BOARD MEETING

No Upcoming Board Meetings

stock-summary
DIVIDEND

No Dividend history available

stock-summary
SPLITS

No Splits history available

stock-summary
BONUS

No Bonus history available

stock-summary
RIGHTS

Praxis Home Retail Ltd has announced 11:30 rights issue, ex-date: 20 Mar 25

stock-summaryKey Factors

Quality key factors stock-summary

Factor
Value
Sales Growth (5y)
-21.82%
EBIT Growth (5y)
8.74%
EBIT to Interest (avg)
-2.35
Debt to EBITDA (avg)
Negative Net Debt
Net Debt to Equity (avg)
-0.58
Sales to Capital Employed (avg)
1.66
Tax Ratio
0
Dividend Payout Ratio
0
Pledged Shares
0
Institutional Holding
1.63%
ROCE (avg)
-34.69%
ROE (avg)
209.60%

Valuation key factors

Factor
Value
P/E Ratio
NA (Loss Making)
Industry P/E
65
Price to Book Value
-1.02
EV to EBIT
-2.75
EV to EBITDA
-4.91
EV to Capital Employed
-3.84
EV to Sales
1.25
PEG Ratio
NA
Dividend Yield
NA
ROCE (Latest)
Negative Capital Employed
ROE (Latest)
Negative BV

Technicals key factors

Indicator
Weekly
Monthly
MACD
Bearish
Bearish
RSI
No Signal
No Signal
Bollinger Bands
Mildly Bearish
Bearish
Moving Averages
Bearish (Daily)
KST
Bearish
Bearish
Dow Theory
No Trend
Bearish
OBV
No Trend
Mildly Bearish
stock-summary Technical Indicator Scale: Bearish, Mildly Bearish, Sideways, Mildly Bullish, Bullish  Turned 
stock-summaryShareholding
Shareholding Snapshot : Jun 2026stock-summary
Shareholding Compare (%holding) stock-summary
Majority shareholders

Non Institution

Pledged Promoter Holdings

None

Mutual Funds

Held by 1 Schemes (0.0%)

FIIs

Held by 2 FIIs (1.37%)

Promoter with highest holding

Surplus Finvest Private Limited (3.24%)

Highest Public shareholder

Elimath Advisors Private Limited (12.85%)

Individual Investors Holdings

48.35%

stock-summaryFinancial
[
  {
    "link": "quarterly",
    "btn_text": "All Quarterly Results",
    "header": "Quarterly Results Snapshot (Standalone) - Jun'26 - YoY",
    "rhs": [
      {
        "prefix": "Net Sales ",
        "suffix": "YoY Growth in quarter ended Jun 2026 is 13.19% vs -25.30% in Jun 2025",
        "dir": 1
      },
      {
        "prefix": "Standalone Net Profit ",
        "suffix": "YoY Growth in quarter ended Jun 2026 is 32.85% vs -69.97% in Jun 2025",
        "dir": 1
      }
    ],
    "table": {
      "header": [
        "Jun'26",
        "Jun'25",
        "Change(%)"
      ],
      "body": [
        {
          "field": "Net Sales",
          "val1": "26.60",
          "val2": "23.50",
          "chgp": "13.19%",
          "chgp_class": "positive"
        },
        {
          "field": "Operating Profit (PBDIT) excl Other Income",
          "val1": "-2.01",
          "val2": "-7.87",
          "chgp": "74.46%",
          "chgp_class": "positive"
        },
        {
          "field": "Interest",
          "val1": "5.62",
          "val2": "4.90",
          "chgp": "14.69%",
          "chgp_class": "negative"
        },
        {
          "field": "Exceptional Items",
          "val1": "0.00",
          "val2": "0.00",
          "chgp": "",
          "chgp_class": "neutral"
        },
        {
          "field": "Standalone Net Profit",
          "val1": "-11.06",
          "val2": "-16.47",
          "chgp": "32.85%",
          "chgp_class": "positive"
        },
        {
          "field": "Operating Profit Margin (Excl OI)",
          "val1": "-7.56%",
          "val2": "-33.49%",
          "chgp": "25.93%",
          "chgp_class": "positive"
        }
      ]
    }
  },
  {
    "link": "half-yearly",
    "btn_text": "All Half Yearly Results",
    "header": "Half Yearly Results Snapshot (Standalone) - Sep'25",
    "rhs": [
      {
        "prefix": "Net Sales ",
        "suffix": " Growth in half year ended Sep 2025 is -22.64% vs -47.14% in Sep 2024",
        "dir": 1
      },
      {
        "prefix": "Standalone Net Profit ",
        "suffix": " Growth in half year ended Sep 2025 is 626.67% vs 63.57% in Sep 2024",
        "dir": 1
      }
    ],
    "table": {
      "header": [
        "Sep'25",
        "Sep'24",
        "Change(%)"
      ],
      "body": [
        {
          "field": "Net Sales",
          "val1": "44.72",
          "val2": "57.81",
          "chgp": "-22.64%",
          "chgp_class": "negative"
        },
        {
          "field": "Operating Profit (PBDIT) excl Other Income",
          "val1": "-13.41",
          "val2": "-26.03",
          "chgp": "48.48%",
          "chgp_class": "positive"
        },
        {
          "field": "Interest",
          "val1": "9.77",
          "val2": "11.39",
          "chgp": "-14.22%",
          "chgp_class": "positive"
        },
        {
          "field": "Exceptional Items",
          "val1": "95.40",
          "val2": "0.00",
          "chgp": "",
          "chgp_class": "neutral"
        },
        {
          "field": "Standalone Net Profit",
          "val1": "64.57",
          "val2": "-12.26",
          "chgp": "626.67%",
          "chgp_class": "positive"
        },
        {
          "field": "Operating Profit Margin (Excl OI)",
          "val1": "-29.99%",
          "val2": "-45.03%",
          "chgp": "15.04%",
          "chgp_class": "positive"
        }
      ]
    }
  },
  {
    "link": "nine-monthly",
    "btn_text": "All Nine Monthly Results",
    "header": "Nine Monthly Results Snapshot (Standalone) - Dec'25",
    "rhs": [
      {
        "prefix": "Net Sales ",
        "suffix": "YoY Growth in nine months ended Dec 2025 is -22.72% vs -47.08% in Dec 2024",
        "dir": 1
      },
      {
        "prefix": "Standalone Net Profit ",
        "suffix": "YoY Growth in nine months ended Dec 2025 is 336.43% vs 60.56% in Dec 2024",
        "dir": 1
      }
    ],
    "table": {
      "header": [
        "Dec'25",
        "Dec'24",
        "Change(%)"
      ],
      "body": [
        {
          "field": "Net Sales",
          "val1": "70.92",
          "val2": "91.77",
          "chgp": "-22.72%",
          "chgp_class": "negative"
        },
        {
          "field": "Operating Profit (PBDIT) excl Other Income",
          "val1": "-22.36",
          "val2": "-25.52",
          "chgp": "12.38%",
          "chgp_class": "positive"
        },
        {
          "field": "Interest",
          "val1": "15.34",
          "val2": "13.32",
          "chgp": "15.17%",
          "chgp_class": "negative"
        },
        {
          "field": "Exceptional Items",
          "val1": "95.40",
          "val2": "0.00",
          "chgp": "",
          "chgp_class": "neutral"
        },
        {
          "field": "Standalone Net Profit",
          "val1": "48.68",
          "val2": "-20.59",
          "chgp": "336.43%",
          "chgp_class": "positive"
        },
        {
          "field": "Operating Profit Margin (Excl OI)",
          "val1": "-31.53%",
          "val2": "-27.81%",
          "chgp": "-3.72%",
          "chgp_class": "negative"
        }
      ]
    }
  },
  {
    "link": "annual",
    "btn_text": "All Annual Results",
    "header": "Annual Results Snapshot (Standalone) - Mar'26",
    "rhs": [
      {
        "prefix": "Net Sales ",
        "suffix": "YoY Growth in year ended Mar 2026 is -19.59% vs -45.82% in Mar 2025",
        "dir": 1
      },
      {
        "prefix": "Standalone Net Profit ",
        "suffix": "YoY Growth in year ended Mar 2026 is -90.42% vs 59.19% in Mar 2025",
        "dir": -1
      }
    ],
    "table": {
      "header": [
        "Mar'26",
        "Mar'25",
        "Change(%)"
      ],
      "body": [
        {
          "field": "Net Sales",
          "val1": "95.66",
          "val2": "118.97",
          "chgp": "-19.59%",
          "chgp_class": "negative"
        },
        {
          "field": "Operating Profit (PBDIT) excl Other Income",
          "val1": "-31.06",
          "val2": "-29.96",
          "chgp": "-3.67%",
          "chgp_class": "negative"
        },
        {
          "field": "Interest",
          "val1": "21.18",
          "val2": "16.72",
          "chgp": "26.67%",
          "chgp_class": "negative"
        },
        {
          "field": "Exceptional Items",
          "val1": "-5.60",
          "val2": "0.00",
          "chgp": "",
          "chgp_class": "neutral"
        },
        {
          "field": "Standalone Net Profit",
          "val1": "-66.61",
          "val2": "-34.98",
          "chgp": "-90.42%",
          "chgp_class": "negative"
        },
        {
          "field": "Operating Profit Margin (Excl OI)",
          "val1": "-32.47%",
          "val2": "-25.18%",
          "chgp": "-7.29%",
          "chgp_class": "negative"
        }
      ]
    }
  }
]

Quarterly Results Snapshot (Standalone) - Jun'26 - YoYstock-summary

Jun'26
Jun'25
Change(%)
Net Sales
26.60
23.50
13.19%
Operating Profit (PBDIT) excl Other Income
-2.01
-7.87
74.46%
Interest
5.62
4.90
14.69%
Exceptional Items
0.00
0.00
Standalone Net Profit
-11.06
-16.47
32.85%
Operating Profit Margin (Excl OI)
-7.56%
-33.49%
25.93%
Values in Rs Cr.
Direction Arrows
Net Sales

YoY Growth in quarter ended Jun 2026 is 13.19% vs -25.30% in Jun 2025

Direction Arrows
Standalone Net Profit

YoY Growth in quarter ended Jun 2026 is 32.85% vs -69.97% in Jun 2025

Half Yearly Results Snapshot (Standalone) - Sep'25stock-summary

Sep'25
Sep'24
Change(%)
Net Sales
44.72
57.81
-22.64%
Operating Profit (PBDIT) excl Other Income
-13.41
-26.03
48.48%
Interest
9.77
11.39
-14.22%
Exceptional Items
95.40
0.00
Standalone Net Profit
64.57
-12.26
626.67%
Operating Profit Margin (Excl OI)
-29.99%
-45.03%
15.04%
Values in Rs Cr.
Direction Arrows
Net Sales

Growth in half year ended Sep 2025 is -22.64% vs -47.14% in Sep 2024

Direction Arrows
Standalone Net Profit

Growth in half year ended Sep 2025 is 626.67% vs 63.57% in Sep 2024

Nine Monthly Results Snapshot (Standalone) - Dec'25stock-summary

Dec'25
Dec'24
Change(%)
Net Sales
70.92
91.77
-22.72%
Operating Profit (PBDIT) excl Other Income
-22.36
-25.52
12.38%
Interest
15.34
13.32
15.17%
Exceptional Items
95.40
0.00
Standalone Net Profit
48.68
-20.59
336.43%
Operating Profit Margin (Excl OI)
-31.53%
-27.81%
-3.72%
Values in Rs Cr.
Direction Arrows
Net Sales

YoY Growth in nine months ended Dec 2025 is -22.72% vs -47.08% in Dec 2024

Direction Arrows
Standalone Net Profit

YoY Growth in nine months ended Dec 2025 is 336.43% vs 60.56% in Dec 2024

Annual Results Snapshot (Standalone) - Mar'26stock-summary

Mar'26
Mar'25
Change(%)
Net Sales
95.66
118.97
-19.59%
Operating Profit (PBDIT) excl Other Income
-31.06
-29.96
-3.67%
Interest
21.18
16.72
26.67%
Exceptional Items
-5.60
0.00
Standalone Net Profit
-66.61
-34.98
-90.42%
Operating Profit Margin (Excl OI)
-32.47%
-25.18%
-7.29%
Values in Rs Cr.
Direction Arrows
Net Sales

YoY Growth in year ended Mar 2026 is -19.59% vs -45.82% in Mar 2025

Direction Arrows
Standalone Net Profit

YoY Growth in year ended Mar 2026 is -90.42% vs 59.19% in Mar 2025

stock-summaryCompany CV
About Praxis Home Retail Ltd stock-summary
stock-summary
Praxis Home Retail Ltd
Micro Cap
Garments & Apparels
Praxis Home Retail Limited (PHRL) was originally incorporated on January 31, 2011 as GRN Energy Private Limited with the Registrar of Companies, Maharashtra at Mumbai. Further, name of the Company was changed to GRN Retail Private Limited on December 21, 2016 and to Praxis Home Retail Private Limited on January 5, 2017. The Company became a Public Company and the name of the Company got changed to Praxis Home Retail Limited in 2017-18.
Company Coordinates stock-summary
Company Details
iThink Techno Campus Jolly, Board Tower D Kanjumarg(East) Mumbai Maharashtra : 400042
stock-summary
Tel: 91-22-71068031
stock-summary
investorrelations@praxisretail.in
Registrar Details
Link Intime India Pvt Ltd, C-13 Pannalal Silk Compound, L B S Marg, Bhandup , Mumbai