
Compare Shalimar Wires with Similar Stocks
Dashboard
High Debt company with Weak Long Term Fundamental Strength
- Poor long term growth as Net Sales has grown by an annual rate of 9.77% over the last 5 years
- High Debt Company with a Debt to Equity ratio (avg) of 2.47 times
- The company has been able to generate a Return on Equity (avg) of 4.95% signifying low profitability per unit of shareholders funds
45.03% of Promoter Shares are Pledged
Consistent Underperformance against the benchmark over the last 3 years
Stock DNA
Garments & Apparels
INR 80 Cr (Micro Cap)
10.00
13
0.00%
1.90
17.82%
1.93
Total Returns (Price + Dividend) 
Shalimar Wires for the last several years.
Risk Adjusted Returns v/s
Returns Beta

News

Shalimar Wires Industries Ltd is Rated Sell
Shalimar Wires Industries Ltd is rated 'Sell' by MarketsMOJO, with this rating last updated on 25 March 2026. However, the analysis and financial metrics discussed here reflect the stock's current position as of 21 July 2026, providing investors with an up-to-date view of the company’s fundamentals, valuation, financial trends, and technical outlook.
Read full news article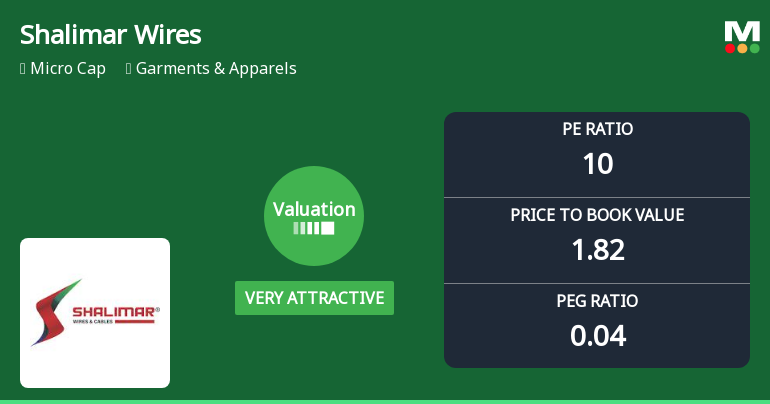
Shalimar Wires Industries Ltd: Valuation Shifts Signal Renewed Price Attractiveness
Shalimar Wires Industries Ltd, a micro-cap player in the Garments & Apparels sector, has seen a notable shift in its valuation parameters, moving from an attractive to a very attractive grade. Despite recent share price declines and mixed returns compared to the broader market, the company’s improved price-to-earnings and price-to-book ratios suggest a compelling entry point for investors willing to navigate its sector-specific challenges.
Read full news article
Shalimar Wires Industries Ltd is Rated Sell
Shalimar Wires Industries Ltd is rated 'Sell' by MarketsMOJO, with this rating last updated on 25 March 2026. However, the analysis and financial metrics discussed here reflect the stock's current position as of 09 July 2026, providing investors with an up-to-date view of the company’s fundamentals, returns, and market standing.
Read full news article Announcements
Announcement U/R 30 Of SEBI (LODR) Regulations 2015
22-Jul-2026 | Source : BSEThe Board of Directors in their meeting held on 4th July 2026 have appointed Mr. Sanjay Kumar Kaushik as an Additional Director (under Non-Executive Category) subject to approval by the shareholders.
Compliances-Certificate under Reg. 74 (5) of SEBI (DP) Regulations 2018
17-Jul-2026 | Source : BSEIn terms of section 74(5) of SEBI (DP) Regulations 2018 we are submitting herewith the certificate regarding confirmation of dematerialization for the period from 01.04.2026 to 30.06.2026 received from RTA.
Announcement Under Regulation 30 Of SEBI (LODR) Regulations 2015
15-Jul-2026 | Source : BSEClarification on price movement of the securities of the Company.
Corporate Actions

No Upcoming Board Meetings

No Dividend history available

Shalimar Wires Industries Ltd has announced 2:10 stock split, ex-date: 23 Dec 10

No Bonus history available

No Rights history available
Quality key factors
Valuation key factors
Technicals key factors
 Technical Indicator Scale: Bearish, Mildly Bearish, Sideways, Mildly Bullish, Bullish Turned
 Shareholding Snapshot : Jun 2026
Shareholding Compare (%holding)
Promoters
45.0302
Held by 8 Schemes (0.0%)
Held by 0 FIIs
Sunita Khaitan (23.67%)
Asset Reconstruction Company (india) Ltd. (25.95%)
5.92%
Quarterly Results Snapshot (Standalone) - Mar'26 - QoQ

QoQ Growth in quarter ended Mar 2026 is 9.39% vs -2.64% in Dec 2025
QoQ Growth in quarter ended Mar 2026 is 129.70% vs -31.76% in Dec 2025
Half Yearly Results Snapshot (Standalone) - Sep'25
Growth in half year ended Sep 2025 is 6.37% vs -0.32% in Sep 2024
Growth in half year ended Sep 2025 is 135.85% vs -60.30% in Sep 2024
Nine Monthly Results Snapshot (Standalone) - Dec'25
YoY Growth in nine months ended Dec 2025 is 8.67% vs 1.39% in Dec 2024
YoY Growth in nine months ended Dec 2025 is 140.41% vs -7.01% in Dec 2024
Annual Results Snapshot (Standalone) - Mar'26
YoY Growth in year ended Mar 2026 is 7.77% vs 2.75% in Mar 2025
YoY Growth in year ended Mar 2026 is 148.72% vs 59.18% in Mar 2025
About Shalimar Wires Industries Ltd

Company Coordinates


