
Compare Shiva Mills with Similar Stocks
Dashboard
Weak Long Term Fundamental Strength with a -183.17% CAGR growth in Operating Profits over the last 5 years
- The company has been able to generate a Return on Equity (avg) of 5.64% signifying low profitability per unit of shareholders funds
Risky - Negative Operating Profits
Consistent Underperformance against the benchmark over the last 3 years
Stock DNA
Garments & Apparels
INR 58 Cr (Micro Cap)
NA (Loss Making)
23
0.00%
0.07
-2.47%
0.60
Total Returns (Price + Dividend) 
Shiva Mills for the last several years.
Risk Adjusted Returns v/s
Returns Beta

News
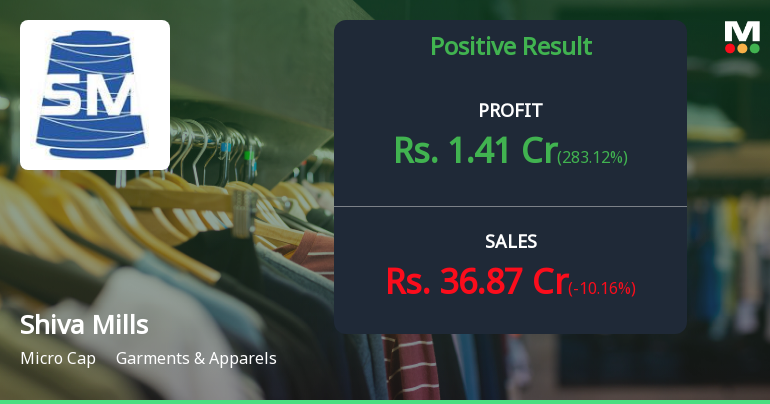
Shiva Mills Q4 FY26: Turnaround Quarter Masks Deeper Structural Challenges
Shiva Mills Ltd., a Coimbatore-based cotton yarn manufacturer, reported a sharp turnaround in Q4 FY26 with net profit of ₹1.41 crores compared to a loss of ₹0.77 crores in the year-ago quarter, marking a swing from red to black. However, the celebration may be premature as revenue declined 10.16% year-on-year to ₹36.87 crores, highlighting persistent demand challenges in the textile sector. The stock, currently trading at ₹66.53 with a modest market capitalisation of ₹58.00 crores, has struggled over the past year, declining 13.44% whilst the broader Sensex fell 6.97%.
Read full news article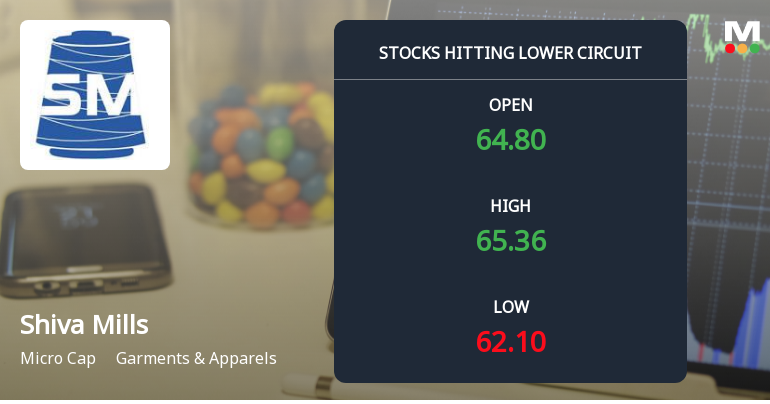
Shiva Mills Ltd Locks at Lower Circuit With 5% Loss — Sellers Queue, No Buyers in Sight
At Rs 62.10, sellers were still queuing — but there were no buyers willing to take the other side. Shiva Mills Ltd locked at its lower circuit of 5% on 21 May 2026, with unfilled sell orders and a frozen price, signalling a pronounced imbalance in supply and demand.
Read full news article
Shiva Mills Ltd is Rated Strong Sell
Shiva Mills Ltd is rated Strong Sell by MarketsMOJO, with this rating last updated on 06 Feb 2025. However, the analysis and financial metrics discussed here reflect the company’s current position as of 18 May 2026, providing investors with an up-to-date view of its fundamentals, returns, and overall market standing.
Read full news article Announcements
Compliances-Reg.24(A)-Annual Secretarial Compliance
25-May-2026 | Source : BSEAnnual Secretarial Compliance Report for the year ended 31.3.2026.
Board Meeting Intimation for Audited Financial Results For The Quarter/Year Ended 31.3.2026.
14-May-2026 | Source : BSEShiva Mills Ltdhas informed BSE that the meeting of the Board of Directors of the Company is scheduled on 27/05/2026 inter alia to consider and approve the Audited Financial Results for the quarter/year ended 31.3.2026.
Announcement under Regulation 30 (LODR)-Newspaper Publication
21-Apr-2026 | Source : BSEAdvertisement in Newspaper - Second 100 days Campaign - Saksham Niveshak
Corporate Actions

No Upcoming Board Meetings

Shiva Mills Ltd has declared 12% dividend, ex-date: 17 Aug 22

No Splits history available

No Bonus history available

No Rights history available
Quality key factors
Valuation key factors
Technicals key factors
 Technical Indicator Scale: Bearish, Mildly Bearish, Sideways, Mildly Bullish, Bullish Turned
 Shareholding Snapshot : Mar 2026
Shareholding Compare (%holding)
Promoters
None
Held by 0 Schemes
Held by 1 FIIs (0.32%)
Annamallai Retreading Company Private Ltd (72.17%)
None
21.85%
Quarterly Results Snapshot (Standalone) - Mar'26 - YoY

YoY Growth in quarter ended Mar 2026 is -10.16% vs -13.27% in Mar 2025
YoY Growth in quarter ended Mar 2026 is 283.12% vs -271.11% in Mar 2025
Half Yearly Results Snapshot (Standalone) - Sep'25

Growth in half year ended Sep 2025 is -26.32% vs 22.78% in Sep 2024
Growth in half year ended Sep 2025 is 49.68% vs 43.53% in Sep 2024
Nine Monthly Results Snapshot (Standalone) - Dec'25
YoY Growth in nine months ended Dec 2025 is -20.28% vs 15.97% in Dec 2024
YoY Growth in nine months ended Dec 2025 is 50.66% vs 17.84% in Dec 2024
Annual Results Snapshot (Standalone) - Mar'26
YoY Growth in year ended Mar 2026 is -17.82% vs 7.21% in Mar 2025
YoY Growth in year ended Mar 2026 is 97.64% vs -17.23% in Mar 2025
About Shiva Mills Ltd

Company Coordinates


