Bharat Dynamics

  • Market Cap: Mid Cap
  • Industry: Aerospace & Defense
  • ISIN: INE171Z01026
  • NSEID: BDL
  • BSEID: 541143
INR
1,294.00
-3 (-0.23%)
BSENSE

Aug 07, 03:30 PM

BSE+NSE Vol: 9.7 lacs

  • Price Points
  • Score
  • Mojo Parameters
  • Total Return
  • News and Corporate Actions
  • Key factors
  • Shareholding
  • Financials
  • CompanyCV
stock-summaryPrice Point
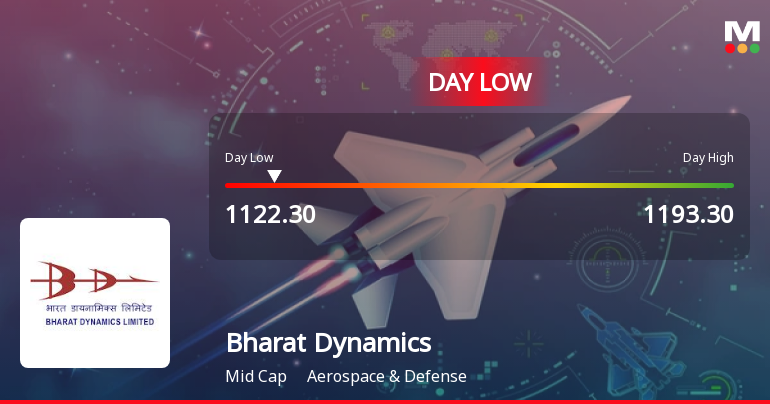
High/Low

1Day

52 Week

Valuation
Technical
Day's Volume

CASH

9.7 lacs (-17.34%) Volume

Shareholding (Jun 2026)

FII

1.69%

Held by 73 FIIs

DII

11.54%

Held by 27 DIIs

Promoter

74.93%

Why is Bharat Dynamics Ltd falling/rising?

08-Aug-2026

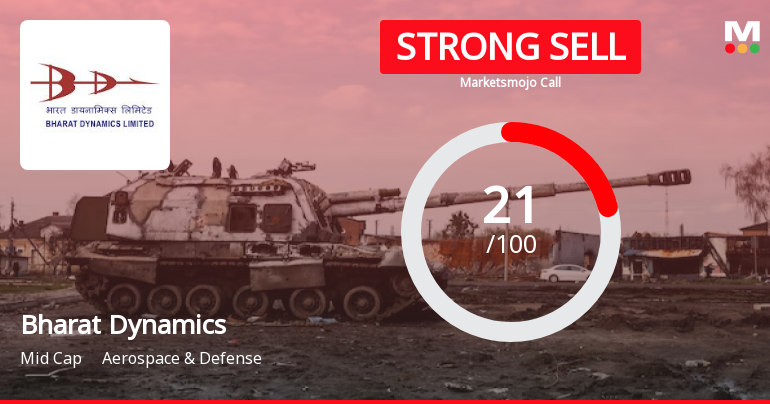
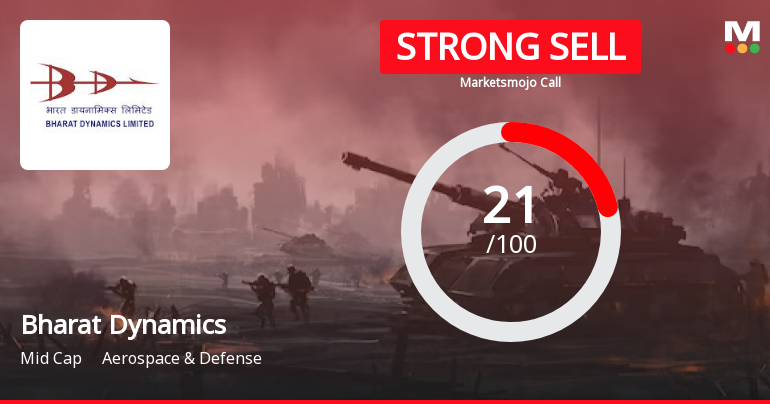
As of 07-Aug, Bharat Dynamics Ltd's stock price is 1,294.00, down 0.23%. The stock has underperformed significantly over the past year due to negative financial results and high valuation, leading to its classification as a strong sell.

As of 07-Aug, Bharat Dynamics Ltd's stock price is currently at 1,294.00, reflecting a decrease of 3.0 (-0.23%). The stock has shown a mixed performance over different time periods, with a notable decline of 7.22% over the past month and a year-to-date drop of 11.76%. The company has also underperformed significantly over the past year, with a return of -17.39%, while the broader market (BSE500) has generated positive returns of 4.11% during the same period.<BR><BR>Several factors contribute to the stock's decline. The company has reported negative results for the last two consecutive quarters, with a significant fall in operating profit of -56.24% reported in March. Additionally, net sales over the latest six months have decreased by -59.88%, and profit after tax (PAT) has fallen by -55.68%. These poor financial results indicate a troubling trend in the company's performance, which has led to a perception of weak long-term growth potential.<BR><BR>Despite being net-debt free and having rising investor participation, as evidenced by a 361.29% increase in delivery volume, the stock's valuation remains high with a price-to-book value of 11.2, which is considered expensive compared to its peers. This combination of declining financial metrics and high valuation has contributed to the stock's downward movement, leading to its classification as a strong sell.

View full answer

Should I buy, sell or hold Bharat Dynamics Ltd?

30-Jun-2026

What does Bharat Dynamics do?

11-Jun-2026

Bharat Dynamics Limited (BDL) is a leading Indian defense manufacturer specializing in Surface to Air missiles, Anti-Tank Guided Missiles, and torpedoes, exclusively supplying these systems to the Indian Armed Forces. As of March 2026, BDL reported net sales of ₹489 Cr and a net profit of ₹113 Cr, with a market cap of ₹43,731 Cr.

Overview: <BR>Bharat Dynamics Limited (BDL) is a leading defense public sector undertaking in India, engaged in the manufacture of Surface to Air missiles (SAMs), Anti-Tank Guided Missiles (ATGMs), torpedoes, and allied defense equipment within the Aerospace & Defense industry.<BR><BR>History: <BR>Bharat Dynamics was incorporated in the year 1970. It is currently the sole manufacturer of SAMs, torpedoes, and ATGMs in India and is the exclusive supplier of these systems to the Indian Armed Forces. The latest quarterly results reported are for March 2026, showing net sales and profit figures.<BR><BR>Financial Snapshot: <BR>Most recent Net Sales: 489 Cr (Quarterly Results - Mar 2026) <BR>Most recent Net Profit: 113 Cr (Quarterly Results - Mar 2026) <BR>Market-cap value: INR 43,731 Cr (Mid Cap) <BR><BR>Key Metrics: <BR>P/E: 103.00 <BR>Industry P/E: 42 <BR>Dividend Yield: 0.43% <BR>Debt-Equity: -1.11 <BR>Return on Equity: 9.91% <BR>Price to Book: 10.39 <BR><BR>Contact Details: <BR>Address: Kanchanbagh Post, Hyderabad Telangana: 500258 <BR>Tel: 91-40-24344979 <BR>Email: investors@bdl-india.com <BR>Website: http://www.bdl-india.com

View full answer

How big is Bharat Dynamics?

11-Jun-2026

As of 10th June, Bharat Dynamics Ltd has a market capitalization of 43,731.00 Cr, with recent net sales of 2,415.35 Cr and a net profit of 420.33 Cr over the latest four quarters.

As of 10th June, <BR><BR>Market Cap: Bharat Dynamics Ltd has a market capitalization of 43,731.00 Cr, categorizing it as a Mid Cap company.<BR><BR>Recent Quarterly Performance: The sum of Net Sales for the latest 4 quarters is 2,415.35 Cr, while the sum of Net Profit for the same period is 420.33 Cr.<BR><BR>Balance Sheet Snapshot: The latest reporting period for the balance sheet is March 2019. Shareholder's Funds are valued at 924.14 Cr, and Total Assets amount to 4,062.83 Cr.

View full answer

Who are in the management team of Bharat Dynamics?

11-Jun-2026

The management team of Bharat Dynamics includes Siddharth Mishra (Chairman & Managing Director), P Radhakrishna (Director - Production), N. Srinivasalu (Director - Finance & CFO), and A. Madhavarao (CMD & Director - Technical), along with several independent and government-nominated directors. This diverse team provides essential expertise for the company's operations and governance.

The management team of Bharat Dynamics includes the following key members:<BR><BR>1. **Siddharth Mishra** - Chairman & Managing Director<BR>2. **P Radhakrishna** - Director (Production)<BR>3. **N. Srinivasalu** - Director (Finance) & CFO<BR>4. **N Nagaraja** - Company Secretary & Compliance Officer<BR>5. **A. Madhavarao** - CMD & Director (Technical)<BR><BR>Additionally, there are several independent directors and nominees on the board:<BR><BR>- **Chandraker Bharti** - Nominee (Government)<BR>- **Sunil Chintaman Mone** - Independent Director<BR>- **Sanhamitra Mishra** - Independent Director<BR>- **Rajendra Singh Shekhawat** - Independent Director<BR>- **Nanda Kumar Subburaman** - Independent Director<BR>- **Pawan Sthapak** - Independent Director<BR>- **Jaswant Lal Sonkar** - Non-Official Director<BR><BR>This diverse team brings a mix of expertise in various areas crucial to the company's operations and governance.

View full answer

Who are the peers of the Bharat Dynamics?

11-Jun-2026

Bharat Dynamics' peers include Bharat Electron, Hind.Aeronautics, Mazagon Dock, Cochin Shipyard, Garden Reach Ship., Data Pattern, MTAR Technologie, Zen Technologies, and Apollo Micro Sys. In terms of management risk, growth, and capital structure, Bharat Dynamics is rated as good, with a 1-year return of -37.68%, lower than its peers.

Peers: The peers of Bharat Dynamics are Bharat Electron, Hind.Aeronautics, Mazagon Dock, Cochin Shipyard, Garden Reach Sh., Data Pattern, MTAR Technologie, Zen Technologies, and Apollo Micro Sys.<BR><BR>Quality Snapshot: Excellent management risk is observed at Bharat Electron, Hind.Aeronautics, Garden Reach Sh., while Good management risk is found at Bharat Dynamics, Cochin Shipyard, Data Pattern, Zen Technologies, and the rest. Average management risk is noted at MTAR Technologie and Apollo Micro Sys. In terms of Growth, Excellent growth is seen at Bharat Electron, Hind.Aeronautics, Garden Reach Sh., and Zen Technologies, while Below Average growth is found at Bharat Dynamics and Cochin Shipyard, and the rest. Good growth is observed at Data Pattern, while Average growth is noted at MTAR Technologie and Apollo Micro Sys. For Capital Structure, Excellent capital structure is present at Bharat Electron, Hind.Aeronautics, Mazagon Dock, Cochin Shipyard, Garden Reach Sh., and the rest, while Good capital structure is seen at MTAR Technologie and Average capital structure at Apollo Micro Sys.<BR><BR>Return Snapshot: The peer with the highest 1-year return is Apollo Micro Sys at 104.19%, while the peer with the lowest is Mazagon Dock at -28.41%. Bharat Dynamics has a 1-year return of -37.68%, which is lower than both. Additionally, the six-month return is negative for Hind.Aeronautics, Mazagon Dock, Cochin Shipyard, and Bharat Dynamics.

View full answer

When is the next results date for Bharat Dynamics Ltd?

21-May-2026

The next results date for Bharat Dynamics Ltd is 28 May 2026.

The next results date for Bharat Dynamics Ltd is scheduled for 28 May 2026.

View full answer

Has Bharat Dynamics Ltd declared dividend?

02-Feb-2026

Yes, Bharat Dynamics Ltd has declared a dividend of 90%, amounting to ₹0.65 per share, with an ex-date of February 9, 2026. The company has shown strong total returns over various periods, particularly in the long term.

Bharat Dynamics Ltd has declared a dividend.<BR><BR>Dividend Details:<BR>- Percentage announced: 90%<BR>- Amount per share: 0.65<BR>- Ex-date: 09 Feb 26<BR><BR>Dividend Yield: 0.34%.<BR><BR>Total Returns by Period:<BR>Over the last 3 months, Bharat Dynamics Ltd experienced a price return of -13.34%, a dividend return of 0.30%, resulting in a total return of -13.04%.<BR><BR>In the last 6 months, the company saw a price return of -15.24%, a dividend return of 0.33%, leading to a total return of -14.91%.<BR><BR>For the 1-year period, there was a price return of 5.51%, a dividend return of 0.76%, culminating in a total return of 6.27%.<BR><BR>Over the past 2 years, the price return was 50.64%, with a dividend return of 2.37%, resulting in a total return of 53.01%.<BR><BR>In the 3-year period, the price return reached 186.05%, while the dividend return was 6.12%, giving a total return of 192.17%.<BR><BR>For the last 4 years, the company achieved a price return of 444.01%, a dividend return of 13.32%, leading to a total return of 457.33%.<BR><BR>Finally, over the past 5 years, Bharat Dynamics Ltd recorded a price return of 696.25%, with a dividend return of 23.81%, resulting in a total return of 720.06%.<BR><BR>Overall, Bharat Dynamics Ltd has declared a significant dividend and has shown strong total returns over multiple periods, particularly in the longer term, indicating a positive performance trajectory for investors.

View full answer

Are Bharat Dynamics Ltd latest results good or bad?

31-Jan-2026

Bharat Dynamics Ltd's latest Q3 FY26 results are poor, with a 52.18% decline in net sales and a 66.22% drop in net profit, raising concerns about operational sustainability and reliance on non-operating income. Investors should approach the stock with caution due to significant volatility and underlying weaknesses.

Bharat Dynamics Ltd's latest results for Q3 FY26 indicate a challenging quarter, reflecting significant operational difficulties. The company reported a net sales decline of 52.18% sequentially, falling to ₹548.56 crores from ₹1,147.08 crores in the previous quarter. This sharp drop in revenue was accompanied by a substantial decrease in net profit, which fell by 66.22% to ₹72.92 crores.<BR><BR>Moreover, the operating profit margins, excluding other income, compressed dramatically to 4.74% from 16.35% in the previous quarter. This margin compression raises concerns about the sustainability of the company's core business profitability, especially since a staggering 94.18% of profit before tax came from non-operating income this quarter.<BR><BR>While the defence sector is benefiting from increased government spending and a push for self-reliance, Bharat Dynamics' performance highlights the volatility inherent in defence manufacturing, where revenues are closely tied to project milestones. The company's reliance on non-operating income and the significant quarter-to-quarter variability in its earnings complicate the outlook for investors.<BR><BR>Overall, the results can be characterized as poor, reflecting both immediate financial challenges and underlying operational weaknesses. Investors may need to approach the stock with caution, considering the current volatility and dependency on non-core income sources.

View full answer

Is Bharat Dynamics technically bullish or bearish?

27-Nov-2025

As of 26 November 2025, Bharat Dynamics has shifted to a mildly bearish trend due to bearish MACD and moving averages, despite some mixed signals from Bollinger Bands and other indicators.

As of 26 November 2025, the technical trend for Bharat Dynamics has changed from mildly bullish to mildly bearish. The current stance is mildly bearish, primarily driven by the bearish MACD on the weekly chart and the bearish moving averages on the daily chart. The Bollinger Bands indicate a bearish trend on the weekly timeframe, while the monthly shows a mildly bullish stance, creating a mixed signal. The KST and OBV are mildly bullish on the weekly and monthly charts, but overall, the bearish indicators outweigh the bullish ones at this time.

View full answer

How has been the historical performance of Bharat Dynamics?

26-Nov-2025

Bharat Dynamics has shown fluctuating financial performance, with net sales and operating income increasing in March 2025, but rising expenditures led to declines in operating profit, profit before tax, and profit after tax, resulting in reduced profit margins. Overall, while sales grew, profitability challenges remain.

Answer:<BR>The historical performance of Bharat Dynamics shows significant fluctuations in key financial metrics over the years.<BR><BR>Breakdown:<BR>Bharat Dynamics has experienced varied net sales over the years, with a notable increase to 3,323.07 crore in March 2025 from 2,350.58 crore in March 2024, following a dip in the previous year. Total operating income also rose to 3,345.05 crore in March 2025, up from 2,369.28 crore in March 2024. However, total expenditure increased significantly to 2,872.68 crore in March 2025 from 1,832.72 crore in March 2024, impacting operating profit, which decreased to 472.37 crore from 536.56 crore. Despite this, profit before tax showed a decline to 748.76 crore in March 2025 from 828.24 crore in March 2024, while profit after tax also fell to 549.65 crore from 612.72 crore. The earnings per share decreased to 14.99 in March 2025 from 16.72 in March 2024. The operating profit margin declined to 14.21% in March 2025 from 22.83% in March 2024, and the profit after tax margin also decreased to 16.54% from 26.07%. Overall, while Bharat Dynamics saw growth in sales and operating income, the rising costs and declining profit margins indicate challenges in maintaining profitability.

View full answer

Who are the top shareholders of the Bharat Dynamics?

17-Jul-2025

The top shareholder of Bharat Dynamics is the President of India, holding 74.93% of shares. Other significant shareholders include Life Insurance Corporation of India (2.79%), individual investors (10.84%), mutual funds (4.98%), and foreign institutional investors (3.26%).

The top shareholders of Bharat Dynamics include the President of India, who holds a significant 74.93% of the shares, making them the largest promoter. Other notable shareholders include Life Insurance Corporation of India, which holds 2.79%, and individual investors, who collectively own 10.84%. Additionally, mutual funds are represented by 26 schemes with a combined holding of 4.98%, while foreign institutional investors (FIIs) hold 3.26% through 114 different entities. There are no pledged promoter holdings reported.

View full answer

Is Bharat Dynamics overvalued or undervalued?

09-Jun-2025

Bharat Dynamics is currently overvalued with a PE ratio of 128.93 and significantly higher EV ratios compared to its peers in the Aerospace & Defense sector, despite a strong year-to-date stock performance of 72.44%.

As of 1 April 2022, Bharat Dynamics has moved from an expensive to a very expensive valuation grade. The company is currently overvalued, with a PE ratio of 128.93, an EV to EBIT ratio of 167.78, and an EV to EBITDA ratio of 142.67. These ratios indicate a significant premium compared to typical industry benchmarks, suggesting that the stock price does not align with its earnings potential.<BR><BR>In comparison to its peers, Bharat Dynamics stands out with a notably high PE ratio, while other companies in the Aerospace & Defense sector typically exhibit lower valuations. For instance, if we consider similar firms, they often have PE ratios significantly below 100, which highlights the disparity. Additionally, the company's recent stock performance has outpaced the Sensex, with a year-to-date return of 72.44% compared to the Sensex's 5.58%, yet this does not mitigate the overvaluation concern.

View full answer
iScoreScore
Click here to find our call on this stock
Strong Sell
Sell
Hold
Buy
Strong Buy

Dashboard

1

Poor long term growth as Operating profit has grown by an annual rate -7.95% of over the last 5 years

 
2

With a fall in Operating Profit of -56.24%, the company declared Very Negative results in Mar 26

3

With ROE of 9.9, it has a Very Expensive valuation with a 11.2 Price to Book Value

4

Underperformed the market in the last 1 year

stock-summaryMojo Parameters

Mojo Parameters

Loading Valuation Snapshot...

Stock DNA

stock-summary
Industry

Aerospace & Defense

stock-summary
Market cap

INR 47,855 Cr (Mid Cap)

stock-summary
P/E

113.00

stock-summary
Industry P/E

45

stock-summary
Dividend Yield

0.40%

stock-summary
Debt Equity

-1.11

stock-summary
Return on Equity

9.91%

stock-summary
Price to Book

11.21

Revenue and Profits:
Net Sales:
489 Cr
(Quarterly Results - Mar 2026)
Net Profit:
113 Cr
stock-summaryTotal Returns
Total Returns (Price + Dividend) stock-summary
Dividend Yield (0.4%)
TimePeriod
Price Return
Dividend Return
Total Return
3 Months
-11.73%
0%
-11.73%
6 Months
1.98%
0%
1.98%
1 Year
-17.39%
0.32%
-17.07%
2 Years
-7.71%
0.75%
-6.96%
3 Years
126.7%
2.61%
129.31%
4 Years
213.85%
4.82%
218.67%
5 Years
549.01%
11.91%
560.92%

Latest dividend: 4.5 per share ex-dividend date: Feb-09-2026

Risk Adjusted Returns v/s stock-summary
Returns Beta
Icon
Beta has not been calculated since enough price history is not available
stock-summaryNews & Corporate Actions

Announcements stock-summary

Board Meeting Intimation for Unaudited Financial Results For The Quarter Ended 30 June 2026

31-Jul-2026 | Source : BSE

Bharat Dynamics Ltdhas informed BSE that the meeting of the Board of Directors of the Company is scheduled on 14/08/2026 inter alia to consider and approve the unaudited Financial results for the quarter ended 30 June 2026

Announcement under Regulation 30 (LODR)-Newspaper Publication

30-Jul-2026 | Source : BSE

Newspaper Publication relating to IEPF

Announcement under Regulation 30 (LODR)-Change in Directorate

09-Jul-2026 | Source : BSE

Appointment of Shri Shailesh Vagerwal as CMD w.e.f 09 July 2026

Corporate Actions stock-summary

stock-summary
BOARD MEETING

14 Aug 2026

stock-summary
DIVIDEND

Bharat Dynamics Ltd has declared 90% dividend, ex-date: 09 Feb 26

stock-summary
SPLITS

Bharat Dynamics Ltd has announced 5:10 stock split, ex-date: 24 May 24

stock-summary
BONUS

No Bonus history available

stock-summary
RIGHTS

No Rights history available

stock-summaryKey Factors

Quality key factors stock-summary

Factor
Value
Sales Growth (5y)
5.10%
EBIT Growth (5y)
-7.95%
EBIT to Interest (avg)
100.00
Debt to EBITDA (avg)
Net Debt is too low
Net Debt to Equity (avg)
-1.11
Sales to Capital Employed (avg)
0.79
Tax Ratio
25.97%
Dividend Payout Ratio
31.01%
Pledged Shares
0
Institutional Holding
13.22%
ROCE (avg)
118.71%
ROE (avg)
13.74%

Valuation key factors

Factor
Value
P/E Ratio
113
Industry P/E
45
Price to Book Value
11.18
EV to EBIT
289.77
EV to EBITDA
191.27
EV to Capital Employed
-91.29
EV to Sales
17.50
PEG Ratio
NA
Dividend Yield
0.40%
ROCE (Latest)
Negative Capital Employed
ROE (Latest)
9.91%

Technicals key factors

Indicator
Weekly
Monthly
MACD
Mildly Bullish
Mildly Bearish
RSI
No Signal
Bullish
Bollinger Bands
Mildly Bearish
Mildly Bearish
Moving Averages
Mildly Bearish (Daily)
KST
Mildly Bullish
Mildly Bearish
Dow Theory
Mildly Bullish
No Trend
OBV
Mildly Bullish
No Trend
stock-summary Technical Indicator Scale: Bearish, Mildly Bearish, Sideways, Mildly Bullish, Bullish  Turned 
stock-summaryShareholding
Shareholding Snapshot : Jun 2026stock-summary
Shareholding Compare (%holding) stock-summary
Majority shareholders

Promoters

Pledged Promoter Holdings

None

Mutual Funds

Held by 27 Schemes (6.42%)

FIIs

Held by 73 FIIs (1.69%)

Promoter with highest holding

President Of India (74.93%)

Highest Public shareholder

Motilal Oswal Large And Midcap Fund (1.85%)

Individual Investors Holdings

10.23%

stock-summaryFinancial
[
  {
    "link": "quarterly",
    "btn_text": "All Quarterly Results",
    "header": "Quarterly Results Snapshot (Standalone) - Mar'26 - YoY",
    "rhs": [
      {
        "prefix": "Net Sales ",
        "suffix": "YoY Growth in quarter ended Mar 2026 is -72.86% vs 112.19% in Mar 2025",
        "dir": -1
      },
      {
        "prefix": "Standalone Net Profit ",
        "suffix": "YoY Growth in quarter ended Mar 2026 is -58.51% vs -5.54% in Mar 2025",
        "dir": -1
      }
    ],
    "table": {
      "header": [
        "Mar'26",
        "Mar'25",
        "Change(%)"
      ],
      "body": [
        {
          "field": "Net Sales",
          "val1": "488.62",
          "val2": "1,800.55",
          "chgp": "-72.86%",
          "chgp_class": "negative"
        },
        {
          "field": "Operating Profit (PBDIT) excl Other Income",
          "val1": "55.24",
          "val2": "298.97",
          "chgp": "-81.52%",
          "chgp_class": "negative"
        },
        {
          "field": "Interest",
          "val1": "0.67",
          "val2": "0.71",
          "chgp": "-5.63%",
          "chgp_class": "positive"
        },
        {
          "field": "Exceptional Items",
          "val1": "0.00",
          "val2": "0.00",
          "chgp": "",
          "chgp_class": "neutral"
        },
        {
          "field": "Standalone Net Profit",
          "val1": "113.18",
          "val2": "272.77",
          "chgp": "-58.51%",
          "chgp_class": "negative"
        },
        {
          "field": "Operating Profit Margin (Excl OI)",
          "val1": "11.31%",
          "val2": "16.60%",
          "chgp": "-5.29%",
          "chgp_class": "negative"
        }
      ]
    }
  },
  {
    "link": "half-yearly",
    "btn_text": "All Half Yearly Results",
    "header": "Half Yearly Results Snapshot (Standalone) - Sep'25",
    "rhs": [
      {
        "prefix": "Net Sales ",
        "suffix": " Growth in half year ended Sep 2025 is 90.56% vs -20.14% in Sep 2024",
        "dir": 1
      },
      {
        "prefix": "Standalone Net Profit ",
        "suffix": " Growth in half year ended Sep 2025 is 80.52% vs -31.32% in Sep 2024",
        "dir": 1
      }
    ],
    "table": {
      "header": [
        "Sep'25",
        "Sep'24",
        "Change(%)"
      ],
      "body": [
        {
          "field": "Net Sales",
          "val1": "1,378.17",
          "val2": "723.24",
          "chgp": "90.56%",
          "chgp_class": "positive"
        },
        {
          "field": "Operating Profit (PBDIT) excl Other Income",
          "val1": "142.13",
          "val2": "46.52",
          "chgp": "205.52%",
          "chgp_class": "positive"
        },
        {
          "field": "Interest",
          "val1": "2.05",
          "val2": "1.89",
          "chgp": "8.47%",
          "chgp_class": "negative"
        },
        {
          "field": "Exceptional Items",
          "val1": "0.00",
          "val2": "0.00",
          "chgp": "",
          "chgp_class": "neutral"
        },
        {
          "field": "Standalone Net Profit",
          "val1": "234.23",
          "val2": "129.75",
          "chgp": "80.52%",
          "chgp_class": "positive"
        },
        {
          "field": "Operating Profit Margin (Excl OI)",
          "val1": "10.31%",
          "val2": "6.43%",
          "chgp": "3.88%",
          "chgp_class": "positive"
        }
      ]
    }
  },
  {
    "link": "nine-monthly",
    "btn_text": "All Nine Monthly Results",
    "header": "Nine Monthly Results Snapshot (Standalone) - Dec'25",
    "rhs": [
      {
        "prefix": "Net Sales ",
        "suffix": "YoY Growth in nine months ended Dec 2025 is 26.55% vs 1.37% in Dec 2024",
        "dir": 1
      },
      {
        "prefix": "Standalone Net Profit ",
        "suffix": "YoY Growth in nine months ended Dec 2025 is 10.93% vs -14.53% in Dec 2024",
        "dir": 1
      }
    ],
    "table": {
      "header": [
        "Dec'25",
        "Dec'24",
        "Change(%)"
      ],
      "body": [
        {
          "field": "Net Sales",
          "val1": "1,926.73",
          "val2": "1,522.53",
          "chgp": "26.55%",
          "chgp_class": "positive"
        },
        {
          "field": "Operating Profit (PBDIT) excl Other Income",
          "val1": "168.11",
          "val2": "173.40",
          "chgp": "-3.05%",
          "chgp_class": "negative"
        },
        {
          "field": "Interest",
          "val1": "2.72",
          "val2": "2.60",
          "chgp": "4.62%",
          "chgp_class": "negative"
        },
        {
          "field": "Exceptional Items",
          "val1": "0.00",
          "val2": "0.00",
          "chgp": "",
          "chgp_class": "neutral"
        },
        {
          "field": "Standalone Net Profit",
          "val1": "307.15",
          "val2": "276.88",
          "chgp": "10.93%",
          "chgp_class": "positive"
        },
        {
          "field": "Operating Profit Margin (Excl OI)",
          "val1": "8.57%",
          "val2": "11.06%",
          "chgp": "-2.49%",
          "chgp_class": "negative"
        }
      ]
    }
  },
  {
    "link": "annual",
    "btn_text": "All Annual Results",
    "header": "Annual Results Snapshot (Standalone) - Mar'26",
    "rhs": [
      {
        "prefix": "Net Sales ",
        "suffix": "YoY Growth in year ended Mar 2026 is -27.32% vs 41.37% in Mar 2025",
        "dir": -1
      },
      {
        "prefix": "Standalone Net Profit ",
        "suffix": "YoY Growth in year ended Mar 2026 is -23.53% vs -10.29% in Mar 2025",
        "dir": -1
      }
    ],
    "table": {
      "header": [
        "Mar'26",
        "Mar'25",
        "Change(%)"
      ],
      "body": [
        {
          "field": "Net Sales",
          "val1": "2,415.36",
          "val2": "3,323.07",
          "chgp": "-27.32%",
          "chgp_class": "negative"
        },
        {
          "field": "Operating Profit (PBDIT) excl Other Income",
          "val1": "223.37",
          "val2": "472.37",
          "chgp": "-52.71%",
          "chgp_class": "negative"
        },
        {
          "field": "Interest",
          "val1": "3.39",
          "val2": "3.31",
          "chgp": "2.42%",
          "chgp_class": "negative"
        },
        {
          "field": "Exceptional Items",
          "val1": "0.00",
          "val2": "0.00",
          "chgp": "",
          "chgp_class": "neutral"
        },
        {
          "field": "Standalone Net Profit",
          "val1": "420.34",
          "val2": "549.65",
          "chgp": "-23.53%",
          "chgp_class": "negative"
        },
        {
          "field": "Operating Profit Margin (Excl OI)",
          "val1": "9.25%",
          "val2": "14.21%",
          "chgp": "-4.96%",
          "chgp_class": "negative"
        }
      ]
    }
  }
]

Quarterly Results Snapshot (Standalone) - Mar'26 - YoYstock-summary

Mar'26
Mar'25
Change(%)
Net Sales
488.62
1,800.55
-72.86%
Operating Profit (PBDIT) excl Other Income
55.24
298.97
-81.52%
Interest
0.67
0.71
-5.63%
Exceptional Items
0.00
0.00
Standalone Net Profit
113.18
272.77
-58.51%
Operating Profit Margin (Excl OI)
11.31%
16.60%
-5.29%
Values in Rs Cr.
Direction Arrows
Net Sales

YoY Growth in quarter ended Mar 2026 is -72.86% vs 112.19% in Mar 2025

Direction Arrows
Standalone Net Profit

YoY Growth in quarter ended Mar 2026 is -58.51% vs -5.54% in Mar 2025

Half Yearly Results Snapshot (Standalone) - Sep'25stock-summary

Sep'25
Sep'24
Change(%)
Net Sales
1,378.17
723.24
90.56%
Operating Profit (PBDIT) excl Other Income
142.13
46.52
205.52%
Interest
2.05
1.89
8.47%
Exceptional Items
0.00
0.00
Standalone Net Profit
234.23
129.75
80.52%
Operating Profit Margin (Excl OI)
10.31%
6.43%
3.88%
Values in Rs Cr.
Direction Arrows
Net Sales

Growth in half year ended Sep 2025 is 90.56% vs -20.14% in Sep 2024

Direction Arrows
Standalone Net Profit

Growth in half year ended Sep 2025 is 80.52% vs -31.32% in Sep 2024

Nine Monthly Results Snapshot (Standalone) - Dec'25stock-summary

Dec'25
Dec'24
Change(%)
Net Sales
1,926.73
1,522.53
26.55%
Operating Profit (PBDIT) excl Other Income
168.11
173.40
-3.05%
Interest
2.72
2.60
4.62%
Exceptional Items
0.00
0.00
Standalone Net Profit
307.15
276.88
10.93%
Operating Profit Margin (Excl OI)
8.57%
11.06%
-2.49%
Values in Rs Cr.
Direction Arrows
Net Sales

YoY Growth in nine months ended Dec 2025 is 26.55% vs 1.37% in Dec 2024

Direction Arrows
Standalone Net Profit

YoY Growth in nine months ended Dec 2025 is 10.93% vs -14.53% in Dec 2024

Annual Results Snapshot (Standalone) - Mar'26stock-summary

Mar'26
Mar'25
Change(%)
Net Sales
2,415.36
3,323.07
-27.32%
Operating Profit (PBDIT) excl Other Income
223.37
472.37
-52.71%
Interest
3.39
3.31
2.42%
Exceptional Items
0.00
0.00
Standalone Net Profit
420.34
549.65
-23.53%
Operating Profit Margin (Excl OI)
9.25%
14.21%
-4.96%
Values in Rs Cr.
Direction Arrows
Net Sales

YoY Growth in year ended Mar 2026 is -27.32% vs 41.37% in Mar 2025

Direction Arrows
Standalone Net Profit

YoY Growth in year ended Mar 2026 is -23.53% vs -10.29% in Mar 2025

stock-summaryCompany CV
About Bharat Dynamics Ltd stock-summary
stock-summary
Bharat Dynamics Ltd
Mid Cap
Aerospace & Defense
Bharat Dynamics Limited (BDL) is one of the leading defence PSUs in India engaged in the manufacture of Surface to Air missiles (SAMs), Anti-Tank Guided Missiles (ATGMs), Torpedoes, and Allied Defence Equipments. The Company is engaged in the business of refurbishment and life extension of stored and deployed missiles. It is the sole manufacturer in India for SAMs, torpedoes, ATGMs. Currently, it is also the sole supplier of SAMs and ATGMs to the Indian Armed Forces.
Company Coordinates stock-summary
Company Details
Kanchanbagh Post , Hyderabad Telangana : 500258
stock-summary
Tel: 91-40-24344979
stock-summary
investors@bdl-india.com
Registrar Details
Alankit Assignments Ltd , 205-208 , Anarkali Complex, Jhandewala Extension, New Delhi