
Compare Cochin Shipyard with Similar Stocks
Dashboard
Poor long term growth as Operating profit has grown by an annual rate 0.79% of over the last 5 years
The company has declared Negative results for the last 3 consecutive quarters
With ROE of 12.2, it has a Very Expensive valuation with a 6.7 Price to Book Value
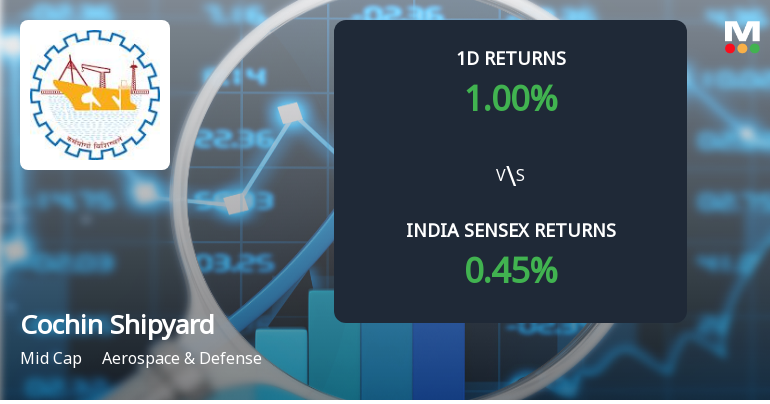
Underperformed the market in the last 1 year
Stock DNA
Aerospace & Defense
INR 38,773 Cr (Mid Cap)
55.00
41
0.50%
-0.13
12.20%
6.66
Total Returns (Price + Dividend) 
Latest dividend: 3.5 per share ex-dividend date: Feb-03-2026
Risk Adjusted Returns v/s
Returns Beta

News
Cochin Shipyard Ltd Sees Sharp Open Interest Surge Amid Mixed Market Signals
Cochin Shipyard Ltd (COCHINSHIP) has witnessed a notable 20.1% surge in open interest in its derivatives segment, signalling heightened market activity and shifting investor positioning. Despite a modest 0.82% gain on the day, the stock has underperformed its Aerospace & Defense sector peers and is grappling with a three-day losing streak, raising questions about the underlying directional bets and market sentiment.
Read full news article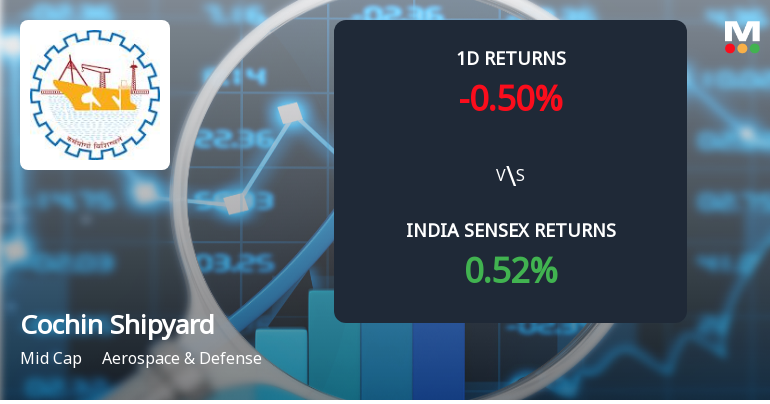
Cochin Shipyard Ltd Sees Sharp Open Interest Surge Amid Mixed Market Signals
Cochin Shipyard Ltd (COCHINSHIP) has witnessed a significant 18.3% surge in open interest in its derivatives segment, signalling heightened market activity and shifting investor positioning. Despite this, the stock’s price movement remains subdued, reflecting a complex interplay of bullish and bearish bets within the Aerospace & Defense sector.
Read full news article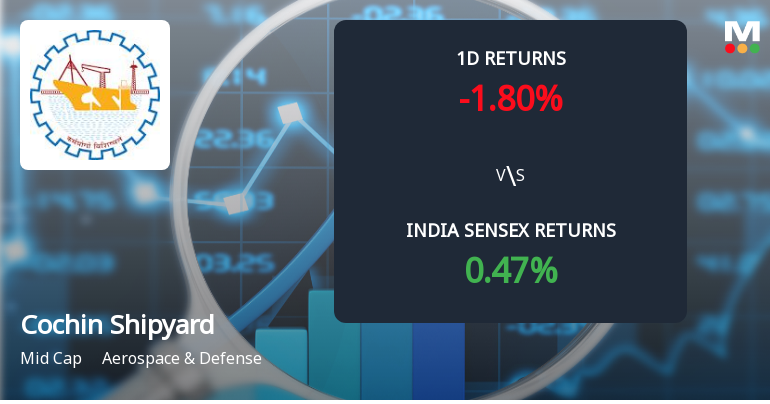
Cochin Shipyard Ltd Sees Sharp Open Interest Surge Amid Bearish Momentum
Cochin Shipyard Ltd (COCHINSHIP) has witnessed a significant 18.3% surge in open interest in its derivatives segment, signalling heightened market activity despite the stock’s recent underperformance. This spike in open interest, coupled with falling prices and subdued investor participation, suggests a complex interplay of directional bets and positioning shifts within the Aerospace & Defense mid-cap stock.
Read full news article Announcements
Announcement under Regulation 30 (LODR)-Updates on Acquisition
11-Jun-2026 | Source : BSEDisclosure pursuant to Regulation 30 of SEBI LODR Regulations
Extension Of Additional Charge Of The Post Of Chairman & Managing Director To Shri Jose V J Director (Finance)
01-Jun-2026 | Source : BSEPlease refer the attachment.
Disclosure Pursuant To Regulation 30 Of The SEBI LODR Regulations
28-May-2026 | Source : BSEPlease refer attachment.
Corporate Actions

No Upcoming Board Meetings

Cochin Shipyard Ltd has declared 70% dividend, ex-date: 03 Feb 26

Cochin Shipyard Ltd has announced 5:10 stock split, ex-date: 10 Jan 24

No Bonus history available

No Rights history available
Quality key factors
Valuation key factors
Technicals key factors
 Technical Indicator Scale: Bearish, Mildly Bearish, Sideways, Mildly Bullish, Bullish Turned
 Shareholding Snapshot : Mar 2026
Shareholding Compare (%holding)
Promoters
None
Held by 24 Schemes (2.07%)
Held by 118 FIIs (3.1%)
President Of India (67.91%)
Life Insurance Corporation Of India (3.34%)
20.39%
Quarterly Results Snapshot (Consolidated) - Mar'26 - YoY

YoY Growth in quarter ended Mar 2026 is -15.55% vs 36.67% in Mar 2025
YoY Growth in quarter ended Mar 2026 is -3.73% vs 10.94% in Mar 2025
Half Yearly Results Snapshot (Consolidated) - Sep'25
Growth in half year ended Sep 2025 is 14.23% vs 28.71% in Sep 2024
Growth in half year ended Sep 2025 is -18.67% vs 29.62% in Sep 2024
Nine Monthly Results Snapshot (Consolidated) - Dec'25
YoY Growth in nine months ended Dec 2025 is 15.52% vs 20.37% in Dec 2024
YoY Growth in nine months ended Dec 2025 is -18.54% vs 2.97% in Dec 2024
Annual Results Snapshot (Consolidated) - Mar'26
YoY Growth in year ended Mar 2026 is 4.19% vs 25.83% in Mar 2025
YoY Growth in year ended Mar 2026 is -13.37% vs 5.62% in Mar 2025
About Cochin Shipyard Ltd

Company Coordinates


