
Compare OBCL with Similar Stocks
Dashboard
Weak Long Term Fundamental Strength with a -189.44% CAGR growth in Operating Profits over the last 5 years
- Low ability to service debt as the company has a high Debt to EBITDA ratio of 66.35 times
- The company has been able to generate a Return on Equity (avg) of 1.26% signifying low profitability per unit of shareholders funds
Flat results in Jun 26
Risky - Negative Operating Profits
Consistent Underperformance against the benchmark over the last 3 years
Stock DNA
Transport Services
INR 110 Cr (Micro Cap)
NA (Loss Making)
39
0.00%
0.81
-9.33%
1.34
Total Returns (Price + Dividend) 
Latest dividend: 0.5 per share ex-dividend date: Aug-27-2020
Risk Adjusted Returns v/s
Returns Beta

News
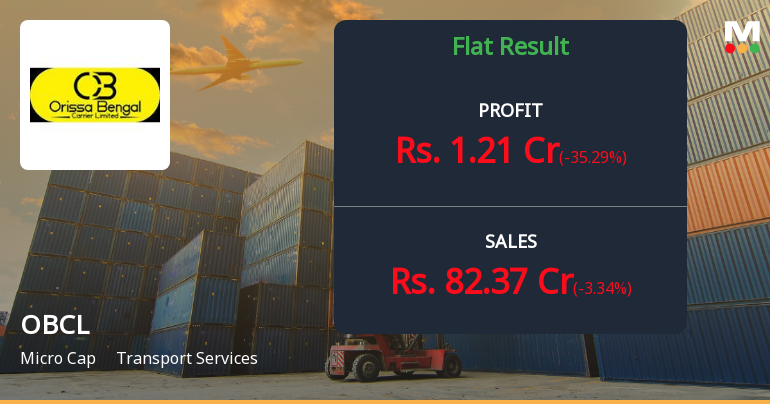
OBCL Ltd Q1 FY27: Profit Recovery Masks Deeper Operational Concerns
Orissa Bengal Carrier Limited (OBCL Ltd.), a micro-cap transport services provider with a market capitalisation of ₹110.00 crores, reported a return to profitability in Q1 FY27 with net profit of ₹1.21 crores, reversing from a loss of ₹5.16 crores in the preceding quarter. However, the year-on-year comparison reveals a concerning 35.29% decline in profitability, whilst revenue contracted 3.34% to ₹82.37 crores. The stock has responded negatively to the underlying weakness, declining 1.79% following the results announcement and trading at ₹52.54, approximately 18.50% below its 52-week high of ₹64.47.
Read full news articleWhen is the next results date for Orissa Bengal Carrier Ltd?
The next results date for Orissa Bengal Carrier Ltd is scheduled for 29 July 2026....
Read full news article
Orissa Bengal Carrier Ltd is Rated Strong Sell
Orissa Bengal Carrier Ltd is rated Strong Sell by MarketsMOJO, with this rating last updated on 08 Jul 2026. However, the analysis and financial metrics presented here reflect the stock’s current position as of 20 July 2026, providing investors with the latest insights into the company’s performance and outlook.
Read full news article Announcements
Board Meeting Intimation for Meeting To Be Held On Wednesday July 29 2026
22-Jul-2026 | Source : BSEOBCL Ltdhas informed BSE that the meeting of the Board of Directors of the Company is scheduled on 29/07/2026 inter alia to consider and approve To consider and approve the Unaudited Financial Results (Standalone & Consolidated) of the Company for the quarter ended June 30 2026 along with the Limited Review Report thereon; and other business matters as mentioned in the enclosed file
Compliances-Certificate under Reg. 74 (5) of SEBI (DP) Regulations 2018
10-Jul-2026 | Source : BSEPlease refer the enclosed file.
Closure of Trading Window
26-Jun-2026 | Source : BSEPlease refer the enclosed file.
Corporate Actions

(29 Jul 2026)

OBCL Ltd has declared 5% dividend, ex-date: 27 Aug 20

No Splits history available

No Bonus history available

No Rights history available
Quality key factors
Valuation key factors
Technicals key factors
 Technical Indicator Scale: Bearish, Mildly Bearish, Sideways, Mildly Bullish, Bullish Turned
 Shareholding Snapshot : Jun 2026
Shareholding Compare (%holding)
Promoters
None
Held by 0 Schemes
Held by 0 FIIs
Ravi Agrawal (47.17%)
Rbg Vyapar Private Limited (2.64%)
20.36%
Quarterly Results Snapshot (Consolidated) - Jun'26 - YoY

YoY Growth in quarter ended Jun 2026 is -3.34% vs 12.98% in Jun 2025
YoY Growth in quarter ended Jun 2026 is -35.29% vs 83.33% in Jun 2025
Half Yearly Results Snapshot (Standalone) - Sep'25

Growth in half year ended Sep 2025 is -3.15% vs -11.54% in Sep 2024
Growth in half year ended Sep 2025 is -200.93% vs -52.85% in Sep 2024
Nine Monthly Results Snapshot (Standalone) - Dec'25
YoY Growth in nine months ended Dec 2025 is -4.57% vs -13.25% in Dec 2024
YoY Growth in nine months ended Dec 2025 is -285.14% vs -63.96% in Dec 2024
Annual Results Snapshot (Consolidated) - Mar'26
YoY Growth in year ended Mar 2026 is 2.47% vs 1.82% in Mar 2025
YoY Growth in year ended Mar 2026 is -438.96% vs -37.40% in Mar 2025
About OBCL Ltd

Company Coordinates


