
Compare Solara Active with Similar Stocks
Dashboard
Weak Long Term Fundamental Strength with a -20.67% CAGR growth in Operating Profits over the last 5 years
- Low ability to service debt as the company has a high Debt to EBITDA ratio of 3.68 times
- The company has been able to generate a Return on Equity (avg) of 0.01% signifying low profitability per unit of shareholders funds
Positive results in Mar 26
With ROCE of 4.6, it has a Attractive valuation with a 1.8 Enterprise value to Capital Employed
Stock DNA
Pharmaceuticals & Biotechnology
INR 2,740 Cr (Small Cap)
NA (Loss Making)
35
0.00%
0.51
-0.12%
2.18
Total Returns (Price + Dividend) 
Latest dividend: 2.8858591973637755 per share ex-dividend date: Aug-18-2021
Risk Adjusted Returns v/s
Returns Beta

News
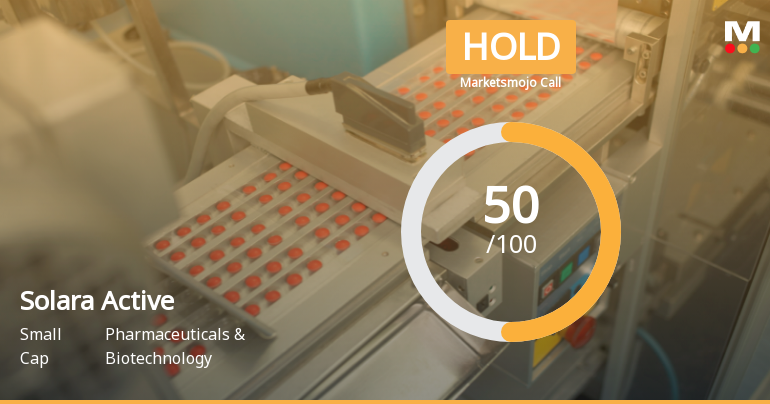
Solara Active Pharma Sciences Ltd Upgraded to Hold on Technical and Financial Improvements
Solara Active Pharma Sciences Ltd has seen its investment rating upgraded from Sell to Hold as of 24 June 2026, reflecting a combination of improved technical indicators and encouraging quarterly financial results. The company’s Mojo Score now stands at 50.0, signalling a more balanced outlook amid mixed fundamental and market signals.
Read full news article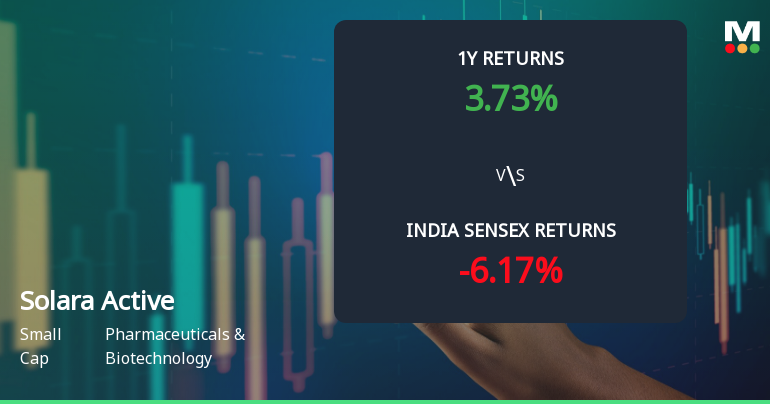
Solara Active Pharma Sciences Ltd Technical Momentum Shifts Amid Mixed Market Signals
Solara Active Pharma Sciences Ltd, a small-cap player in the Pharmaceuticals & Biotechnology sector, has recently experienced a shift in its technical momentum, moving from a sideways trend to a mildly bullish stance. Despite a modest decline in the latest session, the stock’s technical indicators present a nuanced picture, reflecting both bullish and bearish signals across different timeframes.
Read full news article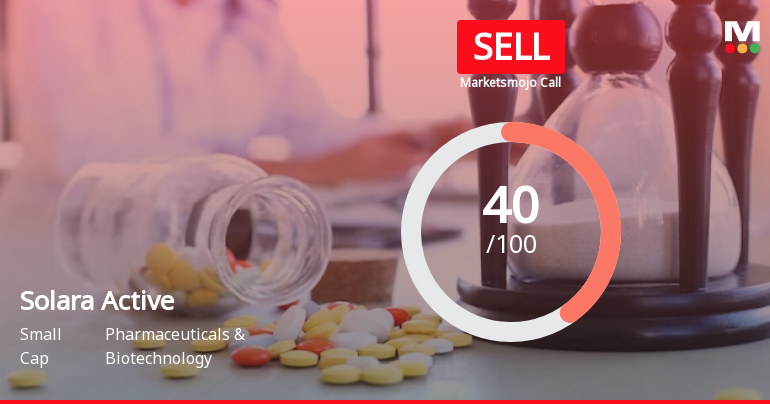
Solara Active Pharma Sciences Ltd is Rated Sell
Solara Active Pharma Sciences Ltd is rated Sell by MarketsMOJO, with this rating last updated on 15 June 2026. However, the analysis and financial metrics discussed here reflect the stock’s current position as of 22 June 2026, providing investors with the latest insights into the company’s performance and outlook.
Read full news article Announcements
Announcement under Regulation 30 (LODR)-Credit Rating
23-Jun-2026 | Source : BSESolara Active Pharma Sciences Limited has informed the Stock Exchange regarding Credit Rating received from Crisil Ratings Limited
Announcement under Regulation 30 (LODR)-Allotment of ESOP / ESPS
16-Jun-2026 | Source : BSEAllotment of 70000 Equity Shares pursuant to exercise of Options under Solara Employee Stock Option Plan 2024
Announcement under Regulation 30 (LODR)-Allotment of ESOP / ESPS
16-Jun-2026 | Source : BSEAllotment of 2250 Equity shares pursuant to exercise of Options under Solara Employee Stock Option Plan 2018
Corporate Actions

No Upcoming Board Meetings

Solara Active Pharma Sciences Ltd has declared 30% dividend, ex-date: 18 Aug 21

No Splits history available

No Bonus history available

Solara Active Pharma Sciences Ltd has announced 1:3 rights issue, ex-date: 15 May 24
Quality key factors
Valuation key factors
Technicals key factors
 Technical Indicator Scale: Bearish, Mildly Bearish, Sideways, Mildly Bullish, Bullish Turned
 Shareholding Snapshot : May 2026
Shareholding Compare (%holding)
Non Institution
36.5742
Held by 3 Schemes (1.16%)
Held by 52 FIIs (11.33%)
Devicam Capital Llp (15.49%)
Authum Investment And Infrastructure Limited (3.79%)
25.15%
Quarterly Results Snapshot (Consolidated) - Mar'26 - QoQ

QoQ Growth in quarter ended Mar 2026 is 10.97% vs 11.31% in Dec 2025

QoQ Growth in quarter ended Mar 2026 is 155.08% vs -72.57% in Dec 2025
Half Yearly Results Snapshot (Consolidated) - Sep'25
Growth in half year ended Sep 2025 is -10.94% vs -8.63% in Sep 2024
Growth in half year ended Sep 2025 is 107.71% vs 85.15% in Sep 2024
Nine Monthly Results Snapshot (Consolidated) - Dec'25
YoY Growth in nine months ended Dec 2025 is -2.88% vs -1.51% in Dec 2024
YoY Growth in nine months ended Dec 2025 is -744.32% vs 100.85% in Dec 2024
Annual Results Snapshot (Consolidated) - Mar'26
YoY Growth in year ended Mar 2026 is 6.64% vs -0.40% in Mar 2025
YoY Growth in year ended Mar 2026 is -1,472.22% vs 100.10% in Mar 2025
About Solara Active Pharma Sciences Ltd

Company Coordinates


