

Key Events This Week
08 Jun: Stock opens week at Rs.525.75, declines 1.98%
09 Jun: Intraday high surge of 8.71%, closing at Rs.577.95 (+9.93%)
10 Jun: Mixed technical signals amid 9.93% price jump to Rs.577.95
11 Jun: Upgraded to Hold by MarketsMOJO; mild bullish technical momentum
12 Jun: Week closes at Rs.607.90, up 4.58% on the day
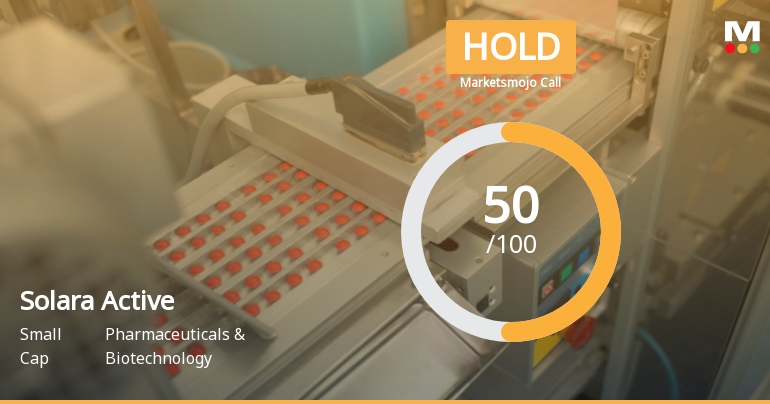
Solara Active Pharma Sciences Ltd Upgraded to Hold on Technical and Financial Improvements
2026-06-11 08:32:19Solara Active Pharma Sciences Ltd has seen its investment rating upgraded from Sell to Hold as of 10 June 2026, reflecting a notable improvement in its technical indicators and recent financial results. The upgrade comes amid a mixed but cautiously optimistic outlook across quality, valuation, financial trends, and technical parameters, signalling a more balanced risk-reward profile for investors.
Read full news article
Solara Active Pharma Sciences Ltd: Technical Momentum Shift Signals Mild Bullish Outlook
2026-06-11 08:05:01Solara Active Pharma Sciences Ltd has recently experienced a shift in its technical momentum, moving from a sideways trend to a mildly bullish stance. Despite a slight dip in the daily price, key indicators such as MACD and Bollinger Bands suggest emerging strength, while moving averages and monthly signals present a more cautious outlook. This nuanced technical picture offers investors a complex but potentially rewarding scenario to analyse.
Read full news article
Solara Active Pharma Sciences Ltd Shows Mixed Technical Signals Amid Price Momentum Shift
2026-06-10 08:06:15Solara Active Pharma Sciences Ltd has experienced a notable shift in its technical momentum, moving from a mildly bearish stance to a sideways trend. Despite a strong day change of 9.93%, the stock’s technical indicators present a complex picture, with bullish signals on weekly charts contrasting with bearish monthly trends. This nuanced technical landscape warrants a detailed analysis for investors navigating the Pharmaceuticals & Biotechnology sector.
Read full news article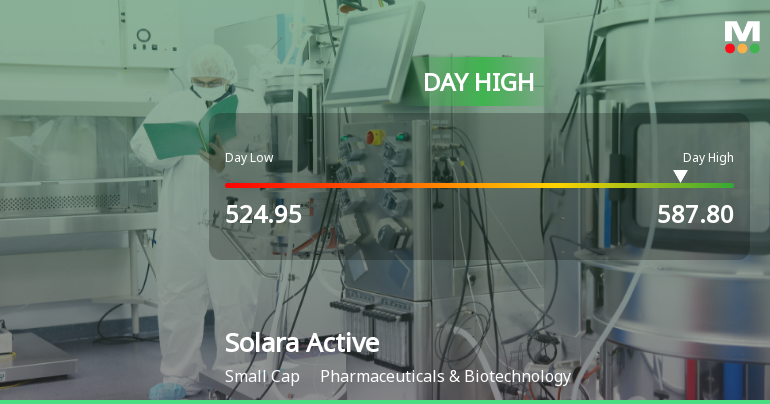
Solara Active Pharma Sciences Ltd Surges 8.7% to Day's High of Rs 577.45 — Outperforms Sector by 8.98 Percentage Points
2026-06-09 13:47:22The Sensex edged up 0.38% on 9 Jun 2026, but Solara Active Pharma Sciences Ltd surged 8.71%, significantly outpacing its Pharmaceuticals & Biotechnology sector by nearly 9 percentage points. This sharp single-session gain rewrites the short-term narrative for the small-cap stock, which also touched an intraday high of Rs 577.45, marking a highly volatile trading day with a 7.04% intraday range.
Read full news article
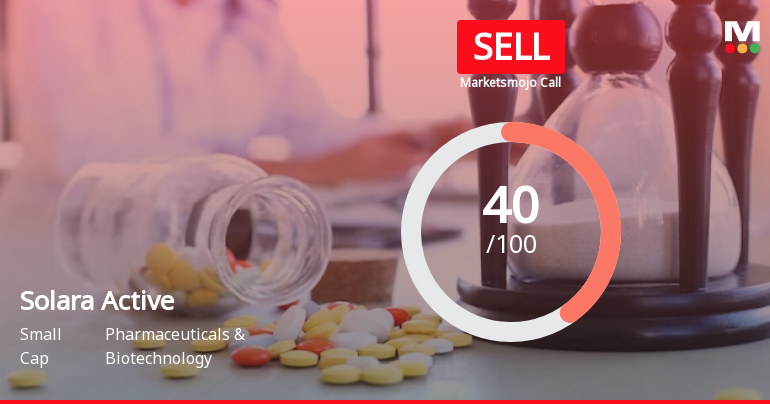
Solara Active Pharma Sciences Ltd is Rated Sell
2026-06-03 10:11:38Solara Active Pharma Sciences Ltd is rated 'Sell' by MarketsMOJO, with this rating last updated on 15 May 2026. However, the analysis and financial metrics discussed here reflect the stock's current position as of 03 June 2026, providing investors with an up-to-date view of the company’s fundamentals, returns, and market standing.
Read full news article
Solara Active Pharma Sciences Ltd Surges 7.87% to Day's High of Rs 567.8 — Outperforms Sector by 5.9 Percentage Points
2026-06-01 12:17:26The Sensex edged down by 0.05% on 01 Jun 2026, while Solara Active Pharma Sciences Ltd surged 7.87%, marking a standout session that outpaced its Pharmaceuticals & Biotechnology sector by nearly six percentage points. This sharp intraday gain rewrites the short-term narrative for the stock, which has been on a positive trajectory over recent weeks.
Read full news article


