Nivaka Fashions

  • Market Cap: Micro Cap
  • Industry: Garments & Apparels
  • ISIN: INE139E01028
  • NSEID:
  • BSEID: 542206
INR
0.72
0.00 (0.00%)
BSENSE

Jul 13, 09:29 AM

BSE+NSE Vol: 22775

  • Price Points
  • Score
  • Mojo Parameters
  • Total Return
  • News and Corporate Actions
  • Key factors
  • Shareholding
  • Financials
  • CompanyCV
stock-summaryPrice Point
High/Low

1Day

52 Week

Valuation
Technical
Day's Volume

CASH

22.77 k (2,262.55%) Volume

Shareholding (Mar 2026)

FII

4.77%

Held by 1 FIIs

DII

0.00%

Held by 0 DIIs

Promoter

24.49%

Why is Nivaka Fashions Ltd falling/rising?

13-Jul-2026

As of 12-Jul, Nivaka Fashions Ltd's stock price is 0.72, unchanged from the previous day, with a year-to-date decline of 77.14% and a one-year drop of 80.06%. Despite a slight increase in trading activity, the stock remains in a bearish trend, trading below all key moving averages and hitting a new 52-week low of Rs. 0.7.

As of 12-Jul, Nivaka Fashions Ltd's stock price is currently at 0.72, with no change from the previous day. The stock has experienced significant declines over various periods, with a year-to-date drop of 77.14% and a one-year decline of 80.06%. These figures indicate a substantial downward trend in the stock's performance compared to the Sensex, which has only decreased by 8.98% over the same timeframe.<BR><BR>Today, the stock hit a new 52-week low of Rs. 0.7, reflecting ongoing struggles in its market performance. Additionally, it has underperformed its sector by 0.27% today and is trading below all key moving averages, including the 5-day, 20-day, 50-day, 100-day, and 200-day averages. This suggests a persistent bearish sentiment among investors.<BR><BR>However, there is a slight positive note with rising investor participation, as the delivery volume increased by 18.35% against the 5-day average, indicating some interest in trading the stock. Despite this uptick in trading activity, the overall performance metrics and the significant declines over the past year strongly suggest that Nivaka Fashions Ltd is currently in a falling trend.

View full answer

What does Nivaka Fashions do?

11-Jun-2026

Nivaka Fashions Ltd is a Micro Cap company specializing in the retail of Indian ethnic wear. It was incorporated in 1983, rebranded in 2019, and reported a net profit of -4 Cr for March 2026, with a market cap of INR 8 Cr.

Overview: <BR>Nivaka Fashions Ltd is engaged in the retailing of Indian ethnic wear and operates within the Garments & Apparels industry, classified as a Micro Cap company.<BR><BR>History: <BR>Nivaka Fashions Limited was incorporated as B. T. Syndicate Limited on March 1, 1983, and changed its name to Nivaka Fashions Limited on May 21, 2019. The most recent quarterly results reported are for March 2026.<BR><BR>Financial Snapshot: <BR>Most recent Net Sales: N/A <BR>Most recent Net Profit: -4 Cr (Quarterly Results - Mar 2026) <BR>Market-cap value: INR 8 Cr (Micro Cap)<BR><BR>Key Metrics: <BR>P/E: N/A <BR>Industry P/E: 21 <BR>Dividend Yield: 0.00% <BR>Debt-Equity: 0.24 <BR>Return on Equity: -118.95% <BR>Price to Book: 1.73<BR><BR>Contact Details: <BR>Address: AA-47 Salt Lake City, Sec 1 BL-AA Kolkata West Bengal : 700064 <BR>Tel: 91-33-40074714 <BR>Email: info@btsync.in <BR>Website: N/A

View full answer

How big is Nivaka Fashions?

11-Jun-2026

As of 10th June, Nivaka Fashions Ltd has a market capitalization of 8.00 Cr, with recent net sales of 0.02 Cr and a net profit loss of 5.21 Cr. Shareholder's funds are 9.59 Cr and total assets amount to 13.83 Cr.

As of 10th June, Nivaka Fashions Ltd has a market capitalization of 8.00 Cr, categorizing it as a Micro Cap company.<BR><BR>In the latest 4 quarters, Nivaka Fashions reported Net Sales of 0.02 Cr and a Net Profit loss of 5.21 Cr.<BR><BR>The latest annual period for the balance sheet is March 2025, with Shareholder's Funds amounting to 9.59 Cr and Total Assets of 13.83 Cr.

View full answer

Who are in the management team of Nivaka Fashions?

11-Jun-2026

The management team of Nivaka Fashions includes Bhavin Shantilal Jain (Chairman & Managing Director), Priyesh Shantilal Shah (Director), Dinesh J Shah (Independent Director), Gayathri (Independent Director), Mitesh Thakkar (Executive Director), and Suman Kumar Verma (Additional Director).

The management team of Nivaka Fashions includes the following members:<BR><BR>1. **Bhavin Shantilal Jain** - Chairman & Managing Director<BR>2. **Priyesh Shantilal Shah** - Director<BR>3. **Dinesh J Shah** - Independent Director<BR>4. **Gayathri** - Independent Director<BR>5. **Mitesh Thakkar** - Executive Director<BR>6. **Suman Kumar Verma** - Additional Director<BR><BR>If you need more specific information about any of these individuals or their roles, feel free to ask!

View full answer

Who are the peers of the Nivaka Fashions?

11-Jun-2026

Nivaka Fashions' peers include Nutech Global, Peeti Securities, Sri Lak.Sar.Arni, Minaxi Textiles, Jayatma Industri, Jagjanani Text., Prem. Synthetic, Kiran Syntex, and Kalahridhaan Tre, with varying management risks and growth rates. Nivaka Fashions has a good capital structure but a significantly lower 1-year return of -78.24% compared to its peers.

Peers: The peers of Nivaka Fashions are Nutech Global, Peeti Securities, Sri Lak.Sar.Arni, Minaxi Textiles, Jayatma Industri, Jagjanani Text., Prem. Synthetic, Kiran Syntex, and Kalahridhaan Tre.<BR><BR>Quality Snapshot: Below Average management risk is observed at Nutech Global, Sri Lak.Sar.Arni, Minaxi Textiles, Jayatma Industri, Prem. Synthetic, Kiran Syntex, and Jagjanani Text., while Average management risk is found at Peeti Securities and Kalahridhaan Tre. Below Average growth is noted for Nutech Global, Sri Lak.Sar.Arni, Minaxi Textiles, Jayatma Industri, Prem. Synthetic, and Jagjanani Text., while Average growth is seen at Kiran Syntex and the rest have Below Average growth. Good capital structure is present at Nivaka Fashions and Peeti Securities, while Below Average capital structure is found at Nutech Global, Sri Lak.Sar.Arni, Minaxi Textiles, Jayatma Industri, Prem. Synthetic, Kiran Syntex, and Kalahridhaan Tre.<BR><BR>Return Snapshot: Nutech Global has the highest 1-year return at 29.04%, while Sri Lak.Sar.Arni has the lowest at -38.16%. Nivaka Fashions' own 1-year return is -78.24%, which is significantly lower than both. Additionally, the six-month return is negative for Nivaka Fashions, Sri Lak.Sar.Arni, Minaxi Textiles, Jayatma Industri, and Prem. Synthetic.

View full answer

Are Nivaka Fashions Ltd latest results good or bad?

02-Jun-2026

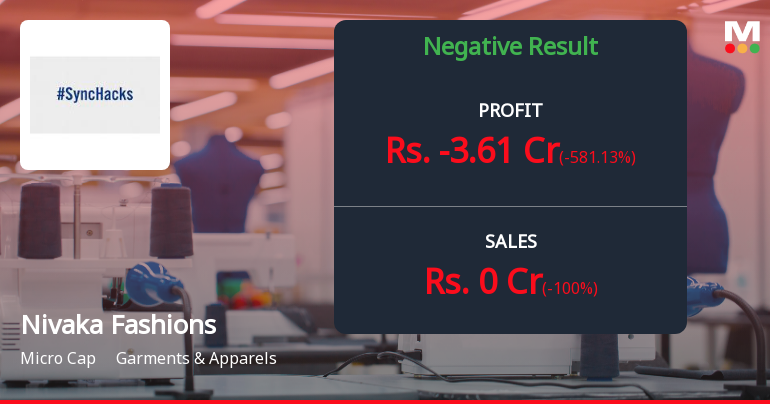
Nivaka Fashions Ltd's latest results are poor, with a net profit of -₹3.61 crores for Q4 FY26, a significant decline in sales, and an 82% drop in market capitalization, indicating severe operational and financial distress.

Nivaka Fashions Ltd's latest results are decidedly bad. The company reported a net profit of -₹3.61 crores for Q4 FY26, marking a staggering decline of 580.19% quarter-over-quarter and a dramatic 1,604.17% drop year-over-year. Notably, net sales for the quarter were effectively zero, indicating a complete operational shutdown.<BR><BR>This performance has led to a significant erosion of market capitalization, down over 82% from its 52-week high. The company's return on equity is alarmingly negative at -61.15%, reflecting severe capital destruction and raising serious concerns about its viability as a business. <BR><BR>Overall, the financial metrics indicate a company in distress, with no meaningful revenue generation and mounting losses, suggesting that Nivaka Fashions is facing existential challenges in its operations.

View full answer

Should I buy, sell or hold Nivaka Fashions Ltd?

31-May-2026

When is the next results date for Nivaka Fashions Ltd?

27-May-2026

The next results date for Nivaka Fashions Ltd is 30 May 2026.

The next results date for Nivaka Fashions Ltd is scheduled for 30 May 2026.

View full answer

How has been the historical performance of Nivaka Fashions?

02-Dec-2025

Nivaka Fashions has experienced a significant decline in net sales and profitability, with net sales dropping from 21.79 Cr in Mar'21 to 1.47 Cr in Mar'25, resulting in continued losses and negative cash flow. Total assets and liabilities have also decreased, reflecting ongoing financial challenges.

Answer:<BR>The historical performance of Nivaka Fashions shows a significant decline in net sales and profitability over the years, with the latest figures indicating continued losses.<BR><BR>Breakdown:<BR>Nivaka Fashions has experienced a substantial decrease in net sales, dropping from 21.79 Cr in Mar'21 to just 1.47 Cr in Mar'25. Other operating income has also seen a decline, with total operating income falling from 21.79 Cr in Mar'21 to 1.84 Cr in Mar'25. The company's total expenditure, excluding depreciation, has decreased from 21.94 Cr in Mar'21 to 1.62 Cr in Mar'25, reflecting a reduction in operational costs. However, despite these reductions, the operating profit has remained low, with a profit before tax of -0.49 Cr in Mar'25 compared to a profit of 0.60 Cr in Mar'21. The profit after tax has also turned negative, reaching -0.50 Cr in Mar'25, down from 0.62 Cr in Mar'21. The company's total assets have decreased from 34.04 Cr in Mar'21 to 13.83 Cr in Mar'25, while total liabilities have also reduced from 34.04 Cr to 13.83 Cr over the same period. Cash flow has been negative in the latest year, with a net cash outflow of -1.00 Cr in Mar'25, indicating ongoing financial challenges for the company.

View full answer

Who are the top shareholders of the Nivaka Fashions?

17-Jul-2025

The top shareholders of Nivaka Fashions include promoter Priyesh Shantilal Jain with 14.0%, public shareholder Dulerai Prabhashankar Sompura at 5.26%, and individual investors holding 50.02%. There are no pledged promoter holdings or mutual funds invested in the company.

The top shareholders of Nivaka Fashions include Priyesh Shantilal Jain, who is the promoter with the highest holding at 14.0%. The highest public shareholder is Dulerai Prabhashankar Sompura, holding 5.26%. Additionally, individual investors collectively hold a significant portion of the company at 50.02%. There is also one foreign institutional investor (FII) that holds 2.47% of the shares. Notably, there are no pledged promoter holdings and no mutual funds currently invested in the company.

View full answer

What is the technical trend for Nivaka Fashions?

09-Jun-2025

As of June 6, 2025, Nivaka Fashions shows a bullish technical trend supported by positive MACD and Bollinger Bands, although there are some cautionary signals from KST and Dow Theory.

As of 6 June 2025, the technical trend for Nivaka Fashions has changed from sideways to bullish. The weekly MACD is bullish, supporting the positive trend, while the monthly MACD is mildly bullish, indicating some strength. Bollinger Bands are bullish on both weekly and monthly time frames, reinforcing the upward momentum. Daily moving averages are also bullish, suggesting short-term strength. However, the KST shows a mildly bearish stance on the monthly, and Dow Theory indicates a mildly bullish position on the weekly but mildly bearish on the monthly, which introduces some caution. Overall, the current technical stance is bullish with moderate strength, driven primarily by the bullish signals from MACD and Bollinger Bands.

View full answer

Is Nivaka Fashions overvalued or undervalued?

09-Jun-2025

As of November 18, 2024, Nivaka Fashions is considered risky and overvalued due to troubling financial ratios, including a PE ratio of -39.54 and an EV to EBITDA ratio of 41.25, despite a recent short-term stock price increase.

As of 18 November 2024, the valuation grade for Nivaka Fashions has moved from very expensive to risky, indicating a significant shift in its perceived value. The company is currently considered overvalued, given its troubling financial ratios, including a PE ratio of -39.54, an EV to EBITDA ratio of 41.25, and a ROE of -5.21%. These figures suggest that the company is struggling to generate profits relative to its market valuation.<BR><BR>In comparison to its peers, Nivaka Fashions' valuation metrics are concerning. For instance, while it has a PE ratio of -39.54, a peer in the same industry might have a more stable PE ratio, highlighting the disparity in performance. Additionally, the company's EV to Sales ratio of 22.54 further emphasizes its overvaluation relative to its sales generation capabilities. Despite a recent uptick in stock price compared to the Sensex, with a 1-week return of 4.48% against the Sensex's 1.40%, the long-term performance remains poor, particularly with a 5-year return of -63.43% compared to the Sensex's 142.99%.

View full answer

What is the bonus history of the Nivaka Fashions?

06-Jun-2025

Nivaka Fashions issued a 4:5 bonus on June 24, 2019, with a record date of June 25, 2019, meaning shareholders received four additional shares for every five shares held.

Nivaka Fashions has a bonus history that includes a 4:5 bonus issue announced on June 24, 2019. The record date for this bonus was June 25, 2019. This means that for every five shares held, shareholders received an additional four shares as a bonus. If you have any more questions about Nivaka Fashions or need further details, feel free to ask!

View full answer

Has Nivaka Fashions declared dividend?

06-Jun-2025

No Dividend History Available

iScoreScore
Click here to find our call on this stock
Strong Sell
Sell
Hold
Buy
Strong Buy

Dashboard

Icon
Unrated Stock - No Analysis Available
stock-summaryMojo Parameters

Mojo Parameters

Loading Valuation Snapshot...

Stock DNA

stock-summary
Industry

Garments & Apparels

stock-summary
Market cap

INR 7 Cr (Micro Cap)

stock-summary
P/E

NA (Loss Making)

stock-summary
Industry P/E

23

stock-summary
Dividend Yield

0.00%

stock-summary
Debt Equity

0.24

stock-summary
Return on Equity

-118.95%

stock-summary
Price to Book

1.69

Revenue and Profits:
Net Sales:
(Quarterly Results - Mar 2026)
Net Profit:
-4 Cr
stock-summaryTotal Returns
Total Returns (Price + Dividend) stock-summary
Dividend Yield (0%)
TimePeriod
Price Return
Dividend Return
Total Return
3 Months
-45.86%
0%
-45.86%
6 Months
-77.14%
0%
-77.14%
1 Year
-79.94%
0%
-79.94%
2 Years
-82.4%
0%
-82.4%
3 Years
-68.0%
0%
-68.0%
4 Years
-83.56%
0%
-83.56%
5 Years
-89.71%
0%
-89.71%

Nivaka Fashions for the last several years.

Risk Adjusted Returns v/s stock-summary
Returns Beta
Icon
Beta has not been calculated since enough price history is not available
stock-summaryNews & Corporate Actions

News

Nivaka Fashions Plunges 19.00% Amid Sharp Quarterly Losses and Negative Trend

Key Events This Week

1 June: Quarterly results reveal sharp losses and negative financial trend

1 June: Stock opens week at Rs.0.95, down 5.00%

5 June: Week closes at Rs.0.81, down 4.71% on final trading day

Announcements stock-summary

Closure of Trading Window

27-Jun-2026 | Source : BSE

As per the SEBI (Prohibition of Insider Trading) Regulations 2015 the Trading Window for dealing in securities of the Company by its Promoters Directors Key Managerial Persons and Designated Persons & their immediate relatives shall remain closed from 1st July 2026 and will be opened 48 hours after declaration of unaudited financial results for the quarter ended June 30 2026. The date of Board Meeting for consideration and declaration of the unaudited financial results for the quarter ended be intimated to you separately.

Announcement under Regulation 30 (LODR)-Change in Management

13-Jun-2026 | Source : BSE

Pursuant to Regulation 30 of the SEBI (Listing Obligations and Disclosure Requirements) Regulations 2015 read with Schedule III thereto we hereby inform you that the Board of Directors of the Company at its meeting held today i.e. Saturday June 13 2026 inter alia approved the appointment of M/s. H R Bohra & Co. Chartered Accountants as the Internal Auditor of the Company for the Financial Year 2025- 26. The appointment has been made consequent to the cessation of the previous Internal Auditor and to ensure continuity of the internal audit function of the Company.

Board Meeting Outcome for Outcome Of Board Meeting Held On Saturday June 13 2026

13-Jun-2026 | Source : BSE

Pursuant to Regulation 30 of the SEBI (Listing Obligations and Disclosure Requirements) Regulations 2015 read with Schedule III thereto we hereby inform you that the Board of Directors of the Company at its meeting held today i.e. Saturday June 13 2026 inter alia approved the appointment of M/s. H R Bohra & Co. Chartered Accountants as the Internal Auditor of the Company for the Financial Year 2025-26. The appointment has been made consequent to the cessation of the previous Internal Auditor and to ensure continuity of the internal audit function of the Company.

Corporate Actions stock-summary

stock-summary
BOARD MEETING

No Upcoming Board Meetings

stock-summary
DIVIDEND

No Dividend history available

stock-summary
SPLITS

No Splits history available

stock-summary
BONUS

Nivaka Fashions Ltd has announced 4:5 bonus issue, ex-date: 24 Jun 19

stock-summary
RIGHTS

No Rights history available

stock-summaryKey Factors

Quality key factors stock-summary

Factor
Value
Sales Growth (5y)
-61.68%
EBIT Growth (5y)
-229.84%
EBIT to Interest (avg)
-0.34
Debt to EBITDA (avg)
0.35
Net Debt to Equity (avg)
0.24
Sales to Capital Employed (avg)
1.69
Tax Ratio
1.45%
Dividend Payout Ratio
0
Pledged Shares
0
Institutional Holding
4.77%
ROCE (avg)
1.95%
ROE (avg)
1.81%

Valuation key factors

Factor
Value
P/E Ratio
NA (Loss Making)
Industry P/E
23
Price to Book Value
1.69
EV to EBIT
-1.68
EV to EBITDA
-1.87
EV to Capital Employed
1.55
EV to Sales
8.45
PEG Ratio
NA
Dividend Yield
NA
ROCE (Latest)
-92.65%
ROE (Latest)
-118.95%

Technicals key factors

Indicator
Weekly
Monthly
MACD
Mildly Bullish
Bearish
RSI
No Signal
No Signal
Bollinger Bands
Bearish
Bearish
Moving Averages
Bearish (Daily)
KST
Mildly Bullish
Bearish
Dow Theory
Bearish
Bearish
stock-summary Technical Indicator Scale: Bearish, Mildly Bearish, Sideways, Mildly Bullish, Bullish  Turned 
stock-summaryShareholding
Shareholding Snapshot : Mar 2026stock-summary
Shareholding Compare (%holding) stock-summary
Majority shareholders

Non Institution

Pledged Promoter Holdings

None

Mutual Funds

Held by 0 Schemes

FIIs

Held by 1 FIIs (4.77%)

Promoter with highest holding

Priyesh Shantilal Jain (14.0%)

Highest Public shareholder

Dulerai Prabhashankar Sompura (5.26%)

Individual Investors Holdings

45.99%

stock-summaryFinancial
[
  {
    "link": "quarterly",
    "btn_text": "All Quarterly Results",
    "header": "Quarterly Results Snapshot (Standalone) - Mar'26 - QoQ",
    "rhs": [
      {
        "prefix": "Net Sales ",
        "suffix": "QoQ Growth in quarter ended Mar 2026 is -100.00% vs 0.00% in Dec 2025",
        "dir": -1
      },
      {
        "prefix": "Standalone Net Profit ",
        "suffix": "QoQ Growth in quarter ended Mar 2026 is -581.13% vs 10.17% in Dec 2025",
        "dir": -1
      }
    ],
    "table": {
      "header": [
        "Mar'26",
        "Dec'25",
        "Change(%)"
      ],
      "body": [
        {
          "field": "Net Sales",
          "val1": "0.00",
          "val2": "0.01",
          "chgp": "-100.00%",
          "chgp_class": "negative"
        },
        {
          "field": "Operating Profit (PBDIT) excl Other Income",
          "val1": "-3.54",
          "val2": "-0.30",
          "chgp": "-1,080.00%",
          "chgp_class": "negative"
        },
        {
          "field": "Interest",
          "val1": "0.01",
          "val2": "0.04",
          "chgp": "-75.00%",
          "chgp_class": "positive"
        },
        {
          "field": "Exceptional Items",
          "val1": "0.00",
          "val2": "0.00",
          "chgp": "",
          "chgp_class": "neutral"
        },
        {
          "field": "Standalone Net Profit",
          "val1": "-3.61",
          "val2": "-0.53",
          "chgp": "-581.13%",
          "chgp_class": "negative"
        },
        {
          "field": "Operating Profit Margin (Excl OI)",
          "val1": "0.00%",
          "val2": "-3,000.00%",
          "chgp": "3,000.00%",
          "chgp_class": "positive"
        }
      ]
    }
  },
  {
    "link": "half-yearly",
    "btn_text": "All Half Yearly Results",
    "header": "Half Yearly Results Snapshot (Standalone) - Sep'25",
    "rhs": [
      {
        "prefix": "Net Sales ",
        "suffix": " Growth in half year ended Sep 2025 is -91.67% vs -88.12% in Sep 2024",
        "dir": -1
      },
      {
        "prefix": "Standalone Net Profit ",
        "suffix": " Growth in half year ended Sep 2025 is -98.15% vs -1,000.00% in Sep 2024",
        "dir": 1
      }
    ],
    "table": {
      "header": [
        "Sep'25",
        "Sep'24",
        "Change(%)"
      ],
      "body": [
        {
          "field": "Net Sales",
          "val1": "0.01",
          "val2": "0.12",
          "chgp": "-91.67%",
          "chgp_class": "negative"
        },
        {
          "field": "Operating Profit (PBDIT) excl Other Income",
          "val1": "-0.66",
          "val2": "-0.19",
          "chgp": "-247.37%",
          "chgp_class": "negative"
        },
        {
          "field": "Interest",
          "val1": "0.15",
          "val2": "0.09",
          "chgp": "66.67%",
          "chgp_class": "negative"
        },
        {
          "field": "Exceptional Items",
          "val1": "0.00",
          "val2": "0.00",
          "chgp": "",
          "chgp_class": "neutral"
        },
        {
          "field": "Standalone Net Profit",
          "val1": "-1.07",
          "val2": "-0.54",
          "chgp": "-98.15%",
          "chgp_class": "negative"
        },
        {
          "field": "Operating Profit Margin (Excl OI)",
          "val1": "-6,600.00%",
          "val2": "-158.33%",
          "chgp": "-6,441.67%",
          "chgp_class": "negative"
        }
      ]
    }
  },
  {
    "link": "nine-monthly",
    "btn_text": "All Nine Monthly Results",
    "header": "Nine Monthly Results Snapshot (Standalone) - Dec'25",
    "rhs": [
      {
        "prefix": "Net Sales ",
        "suffix": "YoY Growth in nine months ended Dec 2025 is -88.24% vs -84.55% in Dec 2024",
        "dir": -1
      },
      {
        "prefix": "Standalone Net Profit ",
        "suffix": "YoY Growth in nine months ended Dec 2025 is -116.22% vs -196.00% in Dec 2024",
        "dir": 1
      }
    ],
    "table": {
      "header": [
        "Dec'25",
        "Dec'24",
        "Change(%)"
      ],
      "body": [
        {
          "field": "Net Sales",
          "val1": "0.02",
          "val2": "0.17",
          "chgp": "-88.24%",
          "chgp_class": "negative"
        },
        {
          "field": "Operating Profit (PBDIT) excl Other Income",
          "val1": "-0.96",
          "val2": "-0.21",
          "chgp": "-357.14%",
          "chgp_class": "negative"
        },
        {
          "field": "Interest",
          "val1": "0.19",
          "val2": "0.14",
          "chgp": "35.71%",
          "chgp_class": "negative"
        },
        {
          "field": "Exceptional Items",
          "val1": "0.00",
          "val2": "0.00",
          "chgp": "",
          "chgp_class": "neutral"
        },
        {
          "field": "Standalone Net Profit",
          "val1": "-1.60",
          "val2": "-0.74",
          "chgp": "-116.22%",
          "chgp_class": "negative"
        },
        {
          "field": "Operating Profit Margin (Excl OI)",
          "val1": "-685.71%",
          "val2": "-42.00%",
          "chgp": "-643.71%",
          "chgp_class": "negative"
        }
      ]
    }
  },
  {
    "link": "annual",
    "btn_text": "All Annual Results",
    "header": "Annual Results Snapshot (Standalone) - Mar'26",
    "rhs": [
      {
        "prefix": "Net Sales ",
        "suffix": "YoY Growth in year ended Mar 2026 is -98.64% vs -8.13% in Mar 2025",
        "dir": -1
      },
      {
        "prefix": "Standalone Net Profit ",
        "suffix": "YoY Growth in year ended Mar 2026 is -942.00% vs -92.31% in Mar 2025",
        "dir": -1
      }
    ],
    "table": {
      "header": [
        "Mar'26",
        "Mar'25",
        "Change(%)"
      ],
      "body": [
        {
          "field": "Net Sales",
          "val1": "0.02",
          "val2": "1.47",
          "chgp": "-98.64%",
          "chgp_class": "negative"
        },
        {
          "field": "Operating Profit (PBDIT) excl Other Income",
          "val1": "-4.47",
          "val2": "0.22",
          "chgp": "-2,131.82%",
          "chgp_class": "negative"
        },
        {
          "field": "Interest",
          "val1": "0.21",
          "val2": "0.20",
          "chgp": "5.00%",
          "chgp_class": "negative"
        },
        {
          "field": "Exceptional Items",
          "val1": "0.00",
          "val2": "0.00",
          "chgp": "",
          "chgp_class": "neutral"
        },
        {
          "field": "Standalone Net Profit",
          "val1": "-5.21",
          "val2": "-0.50",
          "chgp": "-942.00%",
          "chgp_class": "negative"
        },
        {
          "field": "Operating Profit Margin (Excl OI)",
          "val1": "-22,350.00%",
          "val2": "14.97%",
          "chgp": "-22,364.97%",
          "chgp_class": "negative"
        }
      ]
    }
  }
]

Quarterly Results Snapshot (Standalone) - Mar'26 - QoQstock-summary

Mar'26
Dec'25
Change(%)
Net Sales
0.00
0.01
-100.00%
Operating Profit (PBDIT) excl Other Income
-3.54
-0.30
-1,080.00%
Interest
0.01
0.04
-75.00%
Exceptional Items
0.00
0.00
Standalone Net Profit
-3.61
-0.53
-581.13%
Operating Profit Margin (Excl OI)
0.00%
-3,000.00%
3,000.00%
Values in Rs Cr.
Direction Arrows
Net Sales

QoQ Growth in quarter ended Mar 2026 is -100.00% vs 0.00% in Dec 2025

Direction Arrows
Standalone Net Profit

QoQ Growth in quarter ended Mar 2026 is -581.13% vs 10.17% in Dec 2025

Half Yearly Results Snapshot (Standalone) - Sep'25stock-summary

Sep'25
Sep'24
Change(%)
Net Sales
0.01
0.12
-91.67%
Operating Profit (PBDIT) excl Other Income
-0.66
-0.19
-247.37%
Interest
0.15
0.09
66.67%
Exceptional Items
0.00
0.00
Standalone Net Profit
-1.07
-0.54
-98.15%
Operating Profit Margin (Excl OI)
-6,600.00%
-158.33%
-6,441.67%
Values in Rs Cr.
Direction Arrows
Net Sales

Growth in half year ended Sep 2025 is -91.67% vs -88.12% in Sep 2024

Direction Arrows
Standalone Net Profit

Growth in half year ended Sep 2025 is -98.15% vs -1,000.00% in Sep 2024

Nine Monthly Results Snapshot (Standalone) - Dec'25stock-summary

Dec'25
Dec'24
Change(%)
Net Sales
0.02
0.17
-88.24%
Operating Profit (PBDIT) excl Other Income
-0.96
-0.21
-357.14%
Interest
0.19
0.14
35.71%
Exceptional Items
0.00
0.00
Standalone Net Profit
-1.60
-0.74
-116.22%
Operating Profit Margin (Excl OI)
-685.71%
-42.00%
-643.71%
Values in Rs Cr.
Direction Arrows
Net Sales

YoY Growth in nine months ended Dec 2025 is -88.24% vs -84.55% in Dec 2024

Direction Arrows
Standalone Net Profit

YoY Growth in nine months ended Dec 2025 is -116.22% vs -196.00% in Dec 2024

Annual Results Snapshot (Standalone) - Mar'26stock-summary

Mar'26
Mar'25
Change(%)
Net Sales
0.02
1.47
-98.64%
Operating Profit (PBDIT) excl Other Income
-4.47
0.22
-2,131.82%
Interest
0.21
0.20
5.00%
Exceptional Items
0.00
0.00
Standalone Net Profit
-5.21
-0.50
-942.00%
Operating Profit Margin (Excl OI)
-22,350.00%
14.97%
-22,364.97%
Values in Rs Cr.
Direction Arrows
Net Sales

YoY Growth in year ended Mar 2026 is -98.64% vs -8.13% in Mar 2025

Direction Arrows
Standalone Net Profit

YoY Growth in year ended Mar 2026 is -942.00% vs -92.31% in Mar 2025

stock-summaryCompany CV
About Nivaka Fashions Ltd stock-summary
stock-summary
Nivaka Fashions Ltd
Micro Cap
Garments & Apparels
Nivaka Fashions Limited was erstwhile incorporated as B. T. Syndicate Limited on March 1, 1983. The name of the Company was changed from B. T. Syndicate Limited to Nivaka Fashions Limited on May 21, 2019. The Company is engaged in the business of retailing of Indian ethnic wear through omni channel like offline retail stores and online e-commerce website. The Company owns the brand `Ninecolours' and it is quite a well known brand in its domain.
Company Coordinates stock-summary
Company Details
AA-47 Salt Lake City, Sec 1 BL-AA Kolkata West Bengal : 700064
stock-summary
Tel: 91-33-40074714
stock-summary
stock-summary
info@btsync.in
Registrar Details
ABS Consultants Pvt Ltd , Stephen House , 6thFloor, Room No 99, 4 B B D Bag (E), Kolkatta