
Compare KPI Green Energy with Similar Stocks
Dashboard
Low ability to service debt as the company has a high Debt to EBITDA ratio of 5.42 times
- Low ability to service debt as the company has a high Debt to EBITDA ratio of 5.42 times
With ROCE of 11, it has a Expensive valuation with a 1.7 Enterprise value to Capital Employed
44.74% of Promoter Shares are Pledged
Underperformed the market in the last 1 year
Total Returns (Price + Dividend) 
Latest dividend: 0.19856097560975614 per share ex-dividend date: Jan-28-2026
Risk Adjusted Returns v/s
Returns Beta

News
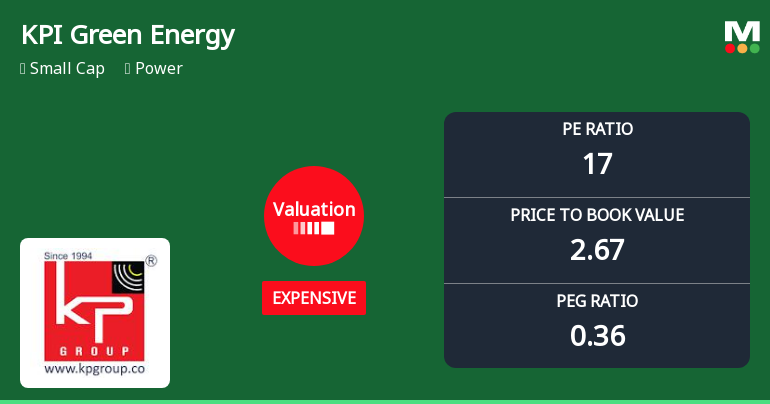
KPI Green Energy Ltd Valuation Shifts Signal Price Attractiveness Challenges
KPI Green Energy Ltd, a small-cap player in the power sector, has seen its valuation parameters shift notably, with its price-to-earnings (P/E) and price-to-book value (P/BV) ratios moving from fair to expensive territory. This change has prompted a downgrade in its Mojo Grade from Hold to Sell, reflecting concerns over price attractiveness amid evolving market dynamics and peer comparisons.
Read full news article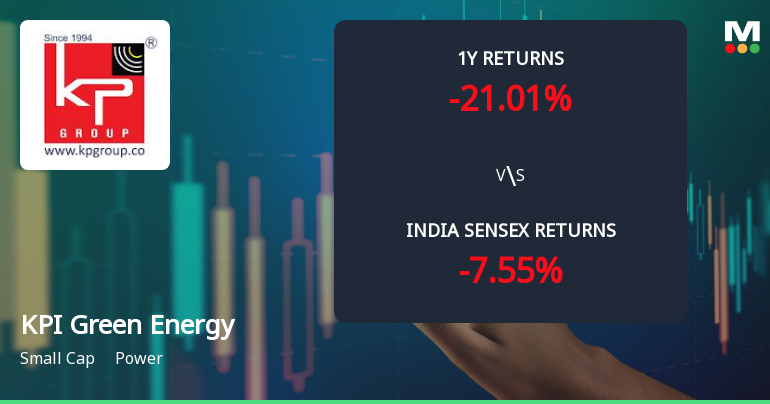
KPI Green Energy Ltd Technical Momentum Shifts Amid Mixed Market Signals
KPI Green Energy Ltd has experienced a notable shift in its technical momentum, moving from a bearish to a mildly bearish trend, reflecting a complex interplay of technical indicators. Despite a 5.19% rise in the stock price to ₹401.40 on 15 Jun 2026, the company’s overall technical and fundamental outlook remains cautious, with a downgrade in its Mojo Grade from Hold to Sell on 11 May 2026.
Read full news article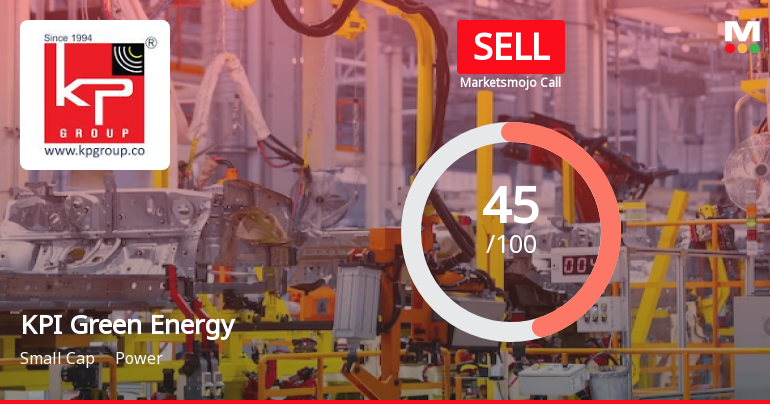
KPI Green Energy Ltd is Rated Sell
KPI Green Energy Ltd is rated Sell by MarketsMOJO, with this rating last updated on 11 May 2026. However, the analysis and financial metrics discussed below reflect the stock’s current position as of 14 June 2026, providing investors with an up-to-date perspective on the company’s fundamentals, valuation, financial trend, and technical outlook.
Read full news article Announcements
Announcement under Regulation 30 (LODR)-Acquisition
19-Jun-2026 | Source : BSEKPI Green Energy Limited has informed the exchange regarding Incorporation of Wholly Owned Subsidiary (WOS). The disclosure is attached herewith.
Announcement under Regulation 30 (LODR)-Analyst / Investor Meet - Intimation
17-Jun-2026 | Source : BSEKPI Green Energy Limited informed the Exchange regarding Site Visit by Analyst(s)/ Institutional Investor(s) scheduled to be held on Monday June 22 2026. The Disclosure is attached herewith.
Announcement under Regulation 30 (LODR)-Analyst / Investor Meet - Intimation
04-Jun-2026 | Source : BSEKPI Green Energy Limited informed Exchange regarding its participation in the Analyst(s)/Institutional Investor(s) Meet scheduled to be held on June 11 2026. Detailed disclosure is attached herewith.
Corporate Actions

No Upcoming Board Meetings

KPI Green Energy Ltd has declared 4% dividend, ex-date: 28 Jan 26

KPI Green Energy Ltd has announced 5:10 stock split, ex-date: 18 Jul 24

KPI Green Energy Ltd has announced 1:2 bonus issue, ex-date: 03 Jan 25

No Rights history available
Quality key factors
Valuation key factors
Technicals key factors
 Technical Indicator Scale: Bearish, Mildly Bearish, Sideways, Mildly Bullish, Bullish Turned
 Shareholding Snapshot : Mar 2026
Shareholding Compare (%holding)
Promoters
44.743
Held by 5 Schemes (0.15%)
Held by 85 FIIs (8.25%)
Farukbhai Gulambhai Patel (48.62%)
Irfanahmed Shahabuddin Mombasawala (1.65%)
33.87%
Quarterly Results Snapshot (Consolidated) - Mar'26 - QoQ

QoQ Growth in quarter ended Mar 2026 is 20.06% vs 4.50% in Dec 2025
QoQ Growth in quarter ended Mar 2026 is 23.35% vs 7.96% in Dec 2025
Half Yearly Results Snapshot (Consolidated) - Sep'25

Growth in half year ended Sep 2025 is 74.83% vs 74.98% in Sep 2024
Growth in half year ended Sep 2025 is 56.72% vs 99.90% in Sep 2024
Nine Monthly Results Snapshot (Consolidated) - Dec'25
YoY Growth in nine months ended Dec 2025 is 62.95% vs 58.74% in Dec 2024
YoY Growth in nine months ended Dec 2025 is 50.08% vs 85.85% in Dec 2024
Annual Results Snapshot (Consolidated) - Mar'26
YoY Growth in year ended Mar 2026 is 55.34% vs 69.49% in Mar 2025
YoY Growth in year ended Mar 2026 is 48.99% vs 97.69% in Mar 2025
About KPI Green Energy Ltd

Company Coordinates


