
Compare Indiamart Inter. with Similar Stocks
Stock DNA
E-Retail/ E-Commerce
INR 11,848 Cr (Small Cap)
25.00
20
3.04%
-1.29
19.78%
4.95
Total Returns (Price + Dividend) 
Latest dividend: 29.942652329749105 per share ex-dividend date: Jun-19-2026
Risk Adjusted Returns v/s
Returns Beta

News

Indiamart Intermesh Ltd is Rated Sell
Indiamart Intermesh Ltd is rated 'Sell' by MarketsMOJO, with this rating last updated on 24 Nov 2025. However, the analysis and financial metrics discussed here reflect the stock's current position as of 21 June 2026, providing investors with an up-to-date view of the company’s fundamentals, valuation, financial trends, and technical outlook.
Read full news article
Indiamart Intermesh Ltd Technical Momentum Shifts Amid Mixed Market Signals
Indiamart Intermesh Ltd has experienced a nuanced shift in its technical momentum, reflecting a complex interplay of bullish and bearish signals across multiple timeframes. Despite a recent upgrade from Hold to Sell by MarketsMOJO, the stock’s price action and technical indicators reveal a landscape of cautious optimism tempered by persistent headwinds in the e-commerce sector.
Read full news article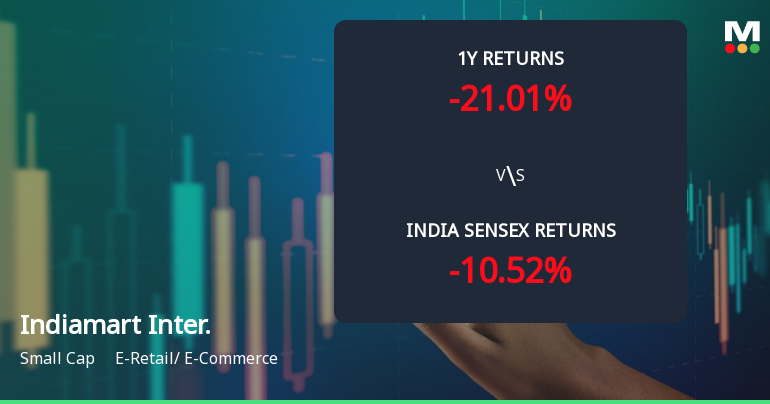
Indiamart Intermesh Ltd Faces Bearish Momentum Amid Technical Downgrade
Indiamart Intermesh Ltd, a small-cap player in the E-Retail and E-Commerce sector, has experienced a notable shift in its technical momentum, prompting a downgrade in its Mojo Grade from Hold to Sell as of 24 Nov 2025. The stock’s recent price action and technical indicators signal a bearish trend, reflecting growing investor caution amid broader market pressures.
Read full news article Announcements
Announcement under Regulation 30 (LODR)-Analyst / Investor Meet - Outcome
17-Jun-2026 | Source : BSEPlease find enclosed outcome of Analyst/Institutional investor meet/call.
Announcement under Regulation 30 (LODR)-Analyst / Investor Meet - Outcome
16-Jun-2026 | Source : BSEPlease find enclosed outcome of Analyst/Institutional investor meet/call.
Announcement under Regulation 30 (LODR)-Analyst / Investor Meet - Outcome
12-Jun-2026 | Source : BSEPlease find enclosed outcome of Analyst/Institutional investor meet/call.
Corporate Actions

No Upcoming Board Meetings

Indiamart Intermesh Ltd has declared 300% dividend, ex-date: 19 Jun 26

No Splits history available

Indiamart Intermesh Ltd has announced 1:1 bonus issue, ex-date: 21 Jun 23

No Rights history available
Quality key factors
Valuation key factors
Technicals key factors
 Technical Indicator Scale: Bearish, Mildly Bearish, Sideways, Mildly Bullish, Bullish Turned
 Shareholding Snapshot : Mar 2026
Shareholding Compare (%holding)
Promoters
None
Held by 20 Schemes (11.85%)
Held by 192 FIIs (19.17%)
Dinesh Chandra Agarwal (28.01%)
Icici Prudential Multi-asset Fund (6.48%)
15.45%
Quarterly Results Snapshot (Consolidated) - Mar'26 - QoQ

QoQ Growth in quarter ended Mar 2026 is 0.67% vs 2.71% in Dec 2025
QoQ Growth in quarter ended Mar 2026 is -73.34% vs 127.69% in Dec 2025
Half Yearly Results Snapshot (Consolidated) - Sep'25
Growth in half year ended Sep 2025 is 12.39% vs 17.72% in Sep 2024
Growth in half year ended Sep 2025 is -5.18% vs 63.34% in Sep 2024
Nine Monthly Results Snapshot (Consolidated) - Dec'25
YoY Growth in nine months ended Dec 2025 is 12.72% vs 17.14% in Dec 2024
YoY Growth in nine months ended Dec 2025 is 14.70% vs 57.89% in Dec 2024
Annual Results Snapshot (Consolidated) - Mar'26
YoY Growth in year ended Mar 2026 is 13.01% vs 16.01% in Mar 2025
YoY Growth in year ended Mar 2026 is -13.80% vs 64.88% in Mar 2025
About Indiamart Intermesh Ltd

Company Coordinates


