
Compare Brainbees Solut. with Similar Stocks
Stock DNA
E-Retail/ E-Commerce
INR 11,159 Cr (Small Cap)
NA (Loss Making)
71
0.00%
0.04
-1.88%
2.34
Total Returns (Price + Dividend) 
Brainbees Solut. for the last several years.
Risk Adjusted Returns v/s
Returns Beta

News

Brainbees Solutions Ltd Upgraded to Sell on Improved Quality and Valuation Metrics
Brainbees Solutions Ltd, a small-cap player in the E-Retail and E-Commerce sector, has seen its investment rating upgraded from Strong Sell to Sell as of 29 May 2026. This change reflects improvements across key parameters including quality, valuation, financial trends, and technical indicators, despite ongoing challenges in profitability and market performance.
Read full news article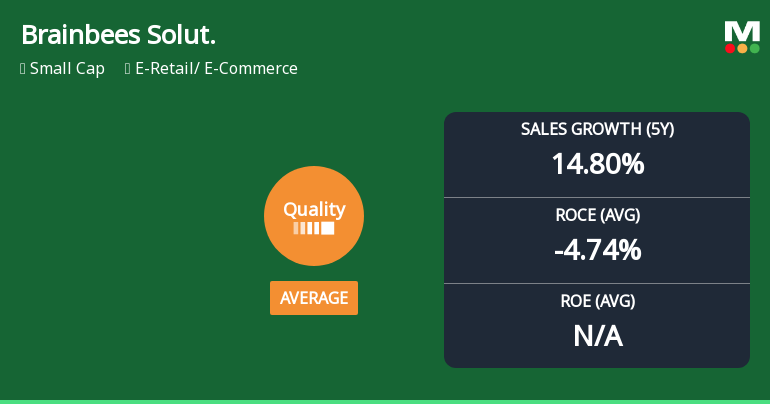
Brainbees Solutions Ltd Quality Grade Upgrade: A Detailed Analysis of Business Fundamentals
Brainbees Solutions Ltd, a small-cap player in the E-Retail and E-Commerce sector, has seen its quality grade improve from below average to average as of 29 May 2026. Despite this upgrade, the company’s fundamentals present a complex picture with some key financial metrics showing improvement while others continue to lag, raising questions about its near-term prospects and investment appeal.
Read full news articleAre Brainbees Solutions Ltd latest results good or bad?
Brainbees Solutions Ltd's latest financial results for Q4 FY26 reveal a complex scenario characterized by growth in revenue but persistent challenges in profitability. The company reported net sales of ₹2,162.67 crores, reflecting a year-on-year growth of 12.04%. However, this figure represents a sequential decline of 10.77% from the previous quarter, which aligns with typical seasonal trends in the e-commerce sector. Despite the revenue growth, the company recorded a net loss of ₹30.31 crores, which is a significant increase in losses compared to the same quarter last year. The profit after tax (PAT) margin remained negative at -2.23%, although it showed some improvement from the previous year's -5.78%. This indicates that while revenue is expanding, the company continues to struggle with converting sales into profits. Operationally, Brainbees Solutions achieved an operating margin of 3.24%, which is an...
Read full news article Announcements
Corporate Actions

No Upcoming Board Meetings

No Dividend history available

No Splits history available

No Bonus history available

No Rights history available
Quality key factors
Valuation key factors
Technicals key factors
 Technical Indicator Scale: Bearish, Mildly Bearish, Sideways, Mildly Bullish, Bullish Turned
 Shareholding Snapshot : Mar 2026
Shareholding Compare (%holding)
Non Institution
None
Held by 19 Schemes (15.42%)
Held by 61 FIIs (3.52%)
None
Svf Frog (cayman) Ltd (19.78%)
8.8%
Quarterly Results Snapshot (Consolidated) - Mar'26 - QoQ

QoQ Growth in quarter ended Mar 2026 is -10.77% vs 15.46% in Dec 2025
QoQ Growth in quarter ended Mar 2026 is -5.50% vs 18.03% in Dec 2025
Half Yearly Results Snapshot (Consolidated) - Sep'25
Growth in half year ended Sep 2025 is 11.38% vs 22.07% in Sep 2024
Growth in half year ended Sep 2025 is 23.80% vs 44.00% in Sep 2024
Nine Monthly Results Snapshot (Consolidated) - Dec'25
YoY Growth in nine months ended Dec 2025 is 11.45% vs 19.01% in Dec 2024
YoY Growth in nine months ended Dec 2025 is 3.93% vs 46.70% in Dec 2024
Annual Results Snapshot (Consolidated) - Mar'26
YoY Growth in year ended Mar 2026 is 11.60% vs 18.19% in Mar 2025
YoY Growth in year ended Mar 2026 is 26.77% vs 30.19% in Mar 2025
About Brainbees Solutions Ltd

Company Coordinates


