
Compare Rossari Biotech with Similar Stocks
Dashboard
The company has declared Negative results for the last 3 consecutive quarters
- OPERATING PROFIT TO INTEREST(Q) Lowest at 7.34 times
- OPERATING CF(Y) Lowest at Rs 58.73 Cr
- DEBT-EQUITY RATIO(HY) Highest at 0.33 times
Falling Participation by Institutional Investors
Consistent Underperformance against the benchmark over the last 3 years
Stock DNA
Specialty Chemicals
INR 2,759 Cr (Small Cap)
18.00
46
0.10%
0.23
11.19%
2.03
Total Returns (Price + Dividend) 
Latest dividend: 0.4997148288973384 per share ex-dividend date: Jul-10-2026
Risk Adjusted Returns v/s
Returns Beta

News
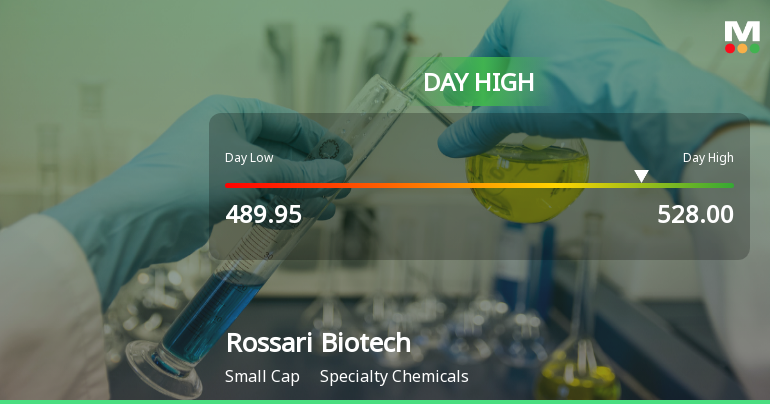
Rossari Biotech Ltd Surges 7.14% to Day's High of Rs 523 — Outperforms Sector by 5.21 Percentage Points
The Sensex advanced 1.06% on 27 Jul 2026, yet Rossari Biotech Ltd outpaced the broader market with a 7.14% gain, reaching an intraday high of Rs 523. This 5.21 percentage-point outperformance over its Specialty Chemicals sector peers highlights a distinctly stock-specific rally rather than a market-wide lift.
Read full news article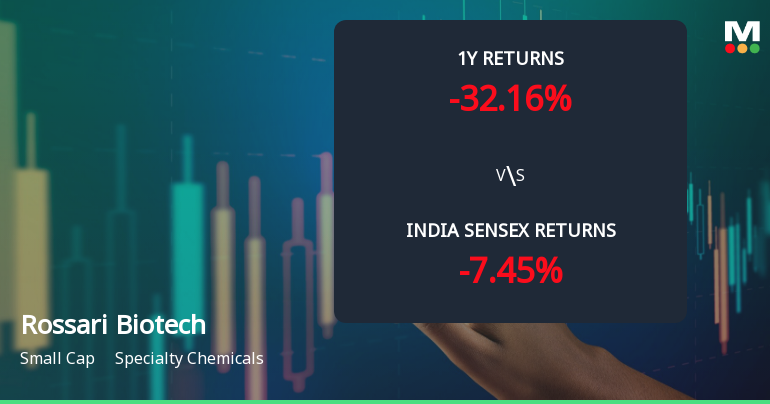
Rossari Biotech Ltd Faces Bearish Momentum Amid Technical Downgrade
Rossari Biotech Ltd, a small-cap player in the specialty chemicals sector, has experienced a notable shift in its technical momentum, with key indicators signalling a bearish trend. The company’s stock price has declined to ₹489.30, down 0.37% from the previous close of ₹491.10, reflecting growing investor caution amid weakening technical signals and underperformance relative to benchmark indices.
Read full news articleAre Rossari Biotech Ltd latest results good or bad?
Rossari Biotech Ltd's latest financial results for Q1 FY27 reveal a complex picture characterized by strong revenue growth alongside notable challenges in profitability and operational efficiency. The company reported net sales of ₹697.20 crores, marking a year-on-year increase of 28.23% and a sequential growth of 1.80%. This performance represents the highest quarterly sales in the company's history, indicating robust market demand. However, the net profit for the same quarter was ₹35.10 crores, which reflects a decline of 23.65% compared to the previous quarter, despite a year-on-year increase of 4.46%. This divergence between revenue growth and profit performance raises concerns about the company's operational efficiency and cost management, particularly in light of rising interest costs and increased depreciation charges. The operating margin improved slightly to 11.56%, up 28 basis points from the pr...
Read full news article Announcements
Announcement under Regulation 30 (LODR)-Earnings Call Transcript
24-Jul-2026 | Source : BSEIntimation of Transcript of Q1 FY 27 for the Earnings Conference Call held on July 20 2026.
Shareholder Meeting / Postal Ballot-Scrutinizers Report
20-Jul-2026 | Source : BSEScrutinizers Report for the 17th Annual General Meeting of the Members of the Company.
Update On Grant Of Options.
20-Jul-2026 | Source : BSEUpdate on Grant of Options.
Corporate Actions

No Upcoming Board Meetings

Rossari Biotech Ltd has declared 25% dividend, ex-date: 10 Jul 26

No Splits history available

No Bonus history available

No Rights history available
Quality key factors
Valuation key factors
Technicals key factors
 Technical Indicator Scale: Bearish, Mildly Bearish, Sideways, Mildly Bullish, Bullish Turned
 Shareholding Snapshot : Jun 2026
Shareholding Compare (%holding)
Promoters
None
Held by 4 Schemes (9.77%)
Held by 42 FIIs (2.02%)
Edward Menezes (29.1%)
Uti-flexi Cap Fund (6.36%)
13.39%
Quarterly Results Snapshot (Consolidated) - Jun'26 - QoQ

QoQ Growth in quarter ended Jun 2026 is 1.80% vs 17.74% in Mar 2026
QoQ Growth in quarter ended Jun 2026 is -23.65% vs 40.28% in Mar 2026
Half Yearly Results Snapshot (Consolidated) - Sep'25

Growth in half year ended Sep 2025 is 14.35% vs 10.51% in Sep 2024
Growth in half year ended Sep 2025 is 0.34% vs 12.96% in Sep 2024
Nine Monthly Results Snapshot (Consolidated) - Dec'25
YoY Growth in nine months ended Dec 2025 is 14.04% vs 10.52% in Dec 2024
YoY Growth in nine months ended Dec 2025 is 1.29% vs 5.56% in Dec 2024
Annual Results Snapshot (Consolidated) - Mar'26
YoY Growth in year ended Mar 2026 is 15.19% vs 13.64% in Mar 2025
YoY Growth in year ended Mar 2026 is 9.41% vs 4.35% in Mar 2025
About Rossari Biotech Ltd

Company Coordinates


