
Compare Rossari Biotech with Similar Stocks
Stock DNA
Specialty Chemicals
INR 2,953 Cr (Small Cap)
20.00
45
0.00%
0.23
11.19%
2.23
Total Returns (Price + Dividend) 
Latest dividend: 0.5 per share ex-dividend date: Aug-16-2024
Risk Adjusted Returns v/s
Returns Beta

News
Rossari Biotech Downgraded to Sell Amid Technical Weakness and Financial Concerns
Rossari Biotech Ltd, a specialty chemicals company, has seen its investment rating downgraded from Hold to Sell as of 24 June 2026. This decision follows a comprehensive reassessment of the company’s quality, valuation, financial trends, and technical indicators, revealing a combination of deteriorating fundamentals and bearish market signals that have weighed on investor sentiment.
Read full news article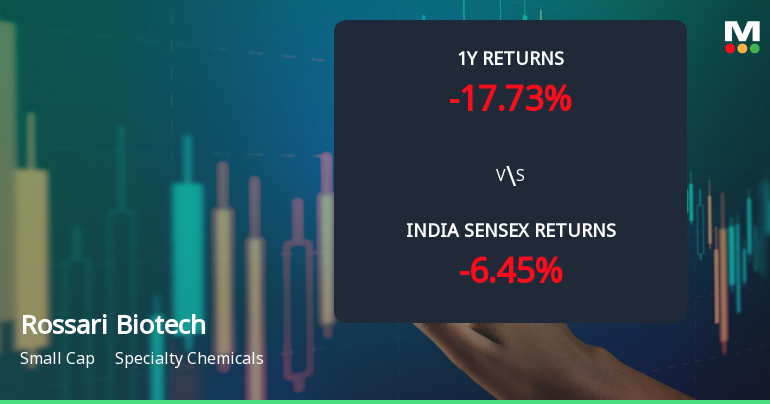
Rossari Biotech Ltd Technical Momentum Shifts Amid Mixed Market Signals
Rossari Biotech Ltd, a small-cap player in the Specialty Chemicals sector, has experienced a notable shift in its technical momentum, moving from a sideways trend to a mildly bearish stance. Despite a recent downgrade in its technical trend, the stock exhibits a complex interplay of bullish and bearish signals across key indicators such as MACD, RSI, Bollinger Bands, and moving averages, reflecting a nuanced outlook for investors.
Read full news article
Rossari Biotech Ltd Upgraded to Hold by MarketsMOJO Amid Mixed Financial and Technical Signals
Rossari Biotech Ltd, a small-cap player in the Specialty Chemicals sector, has seen its investment rating upgraded from Sell to Hold as of 19 June 2026. This revision reflects a nuanced improvement across technical indicators, valuation metrics, and financial trends despite recent quarterly setbacks. The stock’s recent price action and underlying fundamentals have prompted a reassessment of its medium-term prospects by market analysts.
Read full news article Announcements
Announcement under Regulation 30 (LODR)-Newspaper Publication
19-Jun-2026 | Source : BSENewspaper publication of Notice of information regarding the 17th Annual General Meeting of the Company scheduled to be held on Monday July 20 2026.
Intimation Of 17Th Annual General Meeting Of The Company.
18-Jun-2026 | Source : BSEThe Annual General Meeting of the Company is scheduled to be held on Monday July 20 2026.
Intimation Of Record Date
18-Jun-2026 | Source : BSERossari Biotech Limited informed the Exchange that Record date for the purpose of Final Dividend is Friday July 10 2026 and Cut off date for E-voting is Monday July 13 2026.
Corporate Actions

No Upcoming Board Meetings

Rossari Biotech Ltd has declared 25% dividend, ex-date: 10 Jul 26

No Splits history available

No Bonus history available

No Rights history available
Quality key factors
Valuation key factors
Technicals key factors
 Technical Indicator Scale: Bearish, Mildly Bearish, Sideways, Mildly Bullish, Bullish Turned
 Shareholding Snapshot : Mar 2026
Shareholding Compare (%holding)
Promoters
None
Held by 4 Schemes (13.38%)
Held by 43 FIIs (2.18%)
Edward Menezes (29.1%)
Uti-flexi Cap Fund (6.36%)
10.11%
Quarterly Results Snapshot (Consolidated) - Mar'26 - QoQ

QoQ Growth in quarter ended Mar 2026 is 17.74% vs -0.76% in Dec 2025
QoQ Growth in quarter ended Mar 2026 is 40.28% vs -11.14% in Dec 2025
Half Yearly Results Snapshot (Consolidated) - Sep'25
Growth in half year ended Sep 2025 is 14.35% vs 10.51% in Sep 2024

Growth in half year ended Sep 2025 is 0.34% vs 12.96% in Sep 2024
Nine Monthly Results Snapshot (Consolidated) - Dec'25
YoY Growth in nine months ended Dec 2025 is 14.04% vs 10.52% in Dec 2024
YoY Growth in nine months ended Dec 2025 is 1.29% vs 5.56% in Dec 2024
Annual Results Snapshot (Consolidated) - Mar'26
YoY Growth in year ended Mar 2026 is 15.19% vs 13.64% in Mar 2025
YoY Growth in year ended Mar 2026 is 9.41% vs 4.35% in Mar 2025
About Rossari Biotech Ltd

Company Coordinates


