
Compare NOCIL with Similar Stocks
Dashboard
The company is Net-Debt Free
Poor long term growth as Operating profit has grown by an annual rate -13.10% of over the last 5 years
The company has declared Negative results for the last 6 consecutive quarters
With ROE of 3.3, it has a Very Expensive valuation with a 1.8 Price to Book Value
Increasing Participation by Institutional Investors
Stock DNA
Specialty Chemicals
INR 3,242 Cr (Small Cap)
53.00
44
1.05%
-0.19
3.35%
1.80
Total Returns (Price + Dividend) 
Latest dividend: 2 per share ex-dividend date: Jul-30-2025
Risk Adjusted Returns v/s
Returns Beta

News
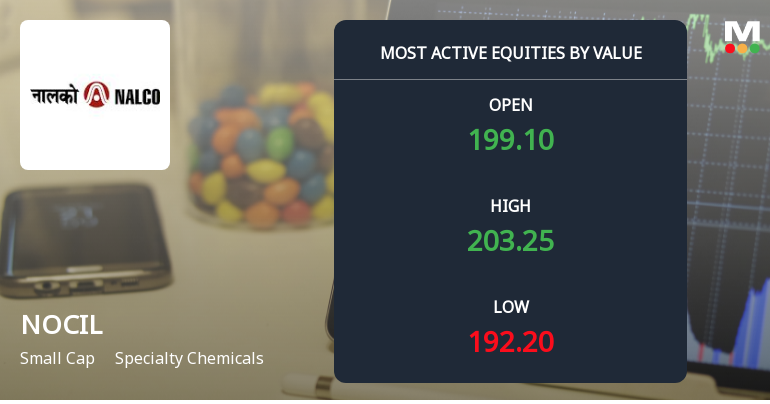
NOCIL Ltd Surges on High-Value Trading and Institutional Interest
NOCIL Ltd, a small-cap player in the Specialty Chemicals sector, has emerged as one of the most actively traded stocks by value on 23 June 2026, reflecting heightened investor interest and robust market momentum. The stock recorded a significant uptick in trading volumes and value, alongside a notable upgrade in its rating, signalling renewed confidence among institutional and retail participants alike.
Read full news article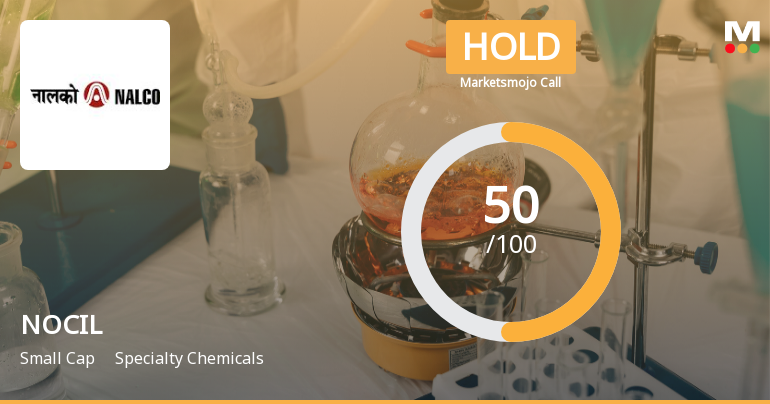
NOCIL Ltd Upgraded to Hold by MarketsMOJO on Improved Technicals and Institutional Interest
NOCIL Ltd, a specialty chemicals company, has seen its investment rating upgraded from Sell to Hold as of 22 June 2026, driven primarily by a marked improvement in technical indicators despite ongoing financial headwinds. The stock’s recent price surge and positive technical momentum have prompted a reassessment of its outlook, though fundamental challenges remain evident.
Read full news article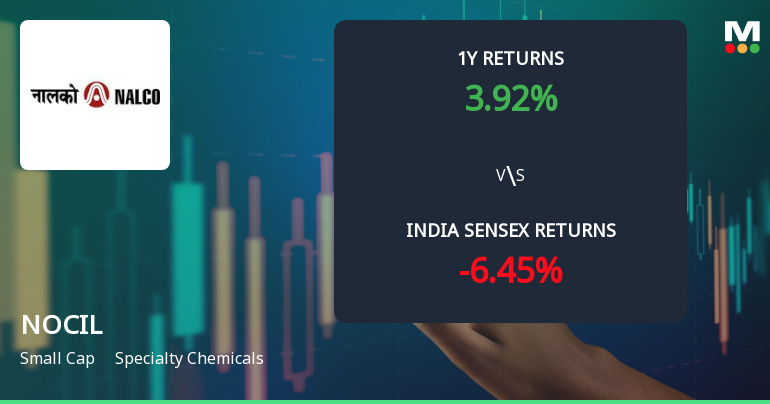
NOCIL Ltd Shares Surge as Technical Momentum Shifts to Bullish Territory
NOCIL Ltd, a specialty chemicals company, has witnessed a significant technical momentum shift, upgrading its technical trend from mildly bullish to bullish. This change is underscored by a robust 19.97% surge in the stock price on 23 Jun 2026, reflecting renewed investor confidence and positive technical signals across multiple timeframes.
Read full news article Announcements
Communication To Shareholders- Intimation Regarding Tax Deduction On Dividend
09-Jun-2026 | Source : BSECommunication to Shareholders- Intimation Regarding Tax Deduction on Dividend
Announcement under Regulation 30 (LODR)-Newspaper Publication
05-Jun-2026 | Source : BSENewspaper Advertisement regarding Annual General Meeting to be held on 3rd August 2026 at 3:00pm
Announcement under Regulation 30 (LODR)-Change in Directorate
26-May-2026 | Source : BSEMr. Vilas R Gupte has ceased to be an Independent Director of the Company upon the completion of his tenure of 5 years on 26th May 2026
Corporate Actions

No Upcoming Board Meetings

NOCIL Ltd has declared 15% dividend, ex-date: 24 Jul 26

No Splits history available

No Bonus history available

No Rights history available
Quality key factors
Valuation key factors
Technicals key factors
 Technical Indicator Scale: Bearish, Mildly Bearish, Sideways, Mildly Bullish, Bullish Turned
 Shareholding Snapshot : Mar 2026
Shareholding Compare (%holding)
Non Institution
22.6445
Held by 8 Schemes (7.13%)
Held by 59 FIIs (4.55%)
Hrishikesh Arvind Mafatlal(as A Trustee Of Gurukripa Trust) (18.16%)
Icici Prudential Commodities Fund (3.35%)
44.36%
Quarterly Results Snapshot (Consolidated) - Mar'26 - QoQ

QoQ Growth in quarter ended Mar 2026 is 4.59% vs -1.47% in Dec 2025
QoQ Growth in quarter ended Mar 2026 is 83.78% vs -23.68% in Dec 2025
Half Yearly Results Snapshot (Consolidated) - Sep'25

Growth in half year ended Sep 2025 is -10.63% vs -1.70% in Sep 2024
Growth in half year ended Sep 2025 is -57.54% vs 12.58% in Sep 2024
Nine Monthly Results Snapshot (Consolidated) - Dec'25
YoY Growth in nine months ended Dec 2025 is -7.63% vs -3.23% in Dec 2024
YoY Growth in nine months ended Dec 2025 is -52.94% vs -10.24% in Dec 2024
Annual Results Snapshot (Consolidated) - Mar'26
YoY Growth in year ended Mar 2026 is -6.44% vs -3.60% in Mar 2025
YoY Growth in year ended Mar 2026 is -45.92% vs -22.66% in Mar 2025
About NOCIL Ltd

Company Coordinates


