
Compare Kalyan Jewellers with Similar Stocks
Dashboard
Healthy long term growth as Net Sales has grown by an annual rate of 33.05% and Operating profit at 39.43%
With a growth in Net Sales of 29.86%, the company declared Very Positive results in Mar 26
With ROCE of 17.9, it has a Fair valuation with a 3.9 Enterprise value to Capital Employed
High Institutional Holdings at 28.68%
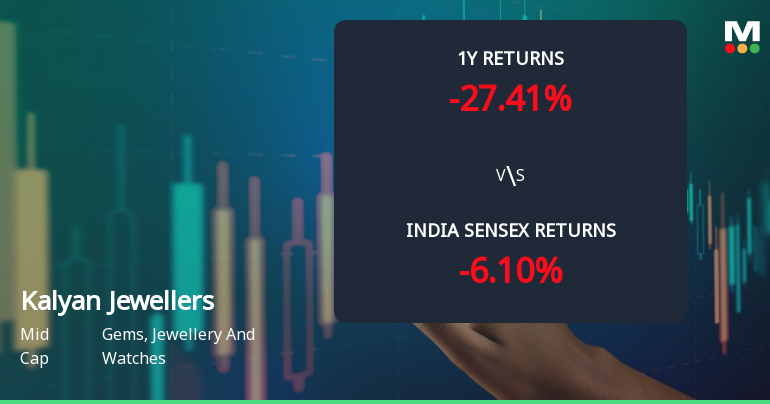
Underperformed the market in the last 1 year
Stock DNA
Gems, Jewellery And Watches
INR 38,919 Cr (Mid Cap)
29.00
48
0.39%
0.83
21.89%
6.27
Total Returns (Price + Dividend) 
Latest dividend: 1.5 per share ex-dividend date: Sep-04-2025
Risk Adjusted Returns v/s
Returns Beta

News
Kalyan Jewellers India Ltd Technical Momentum Shifts Amid Mixed Market Signals
Kalyan Jewellers India Ltd has experienced a nuanced shift in its technical momentum, moving from a bearish stance to a mildly bearish outlook, reflecting a complex interplay of technical indicators. Despite a recent downgrade in daily moving averages and persistent bearish signals from MACD, some weekly indicators suggest emerging bullish tendencies, signalling a cautious but watchful market sentiment towards this mid-cap player in the gems and jewellery sector.
Read full news article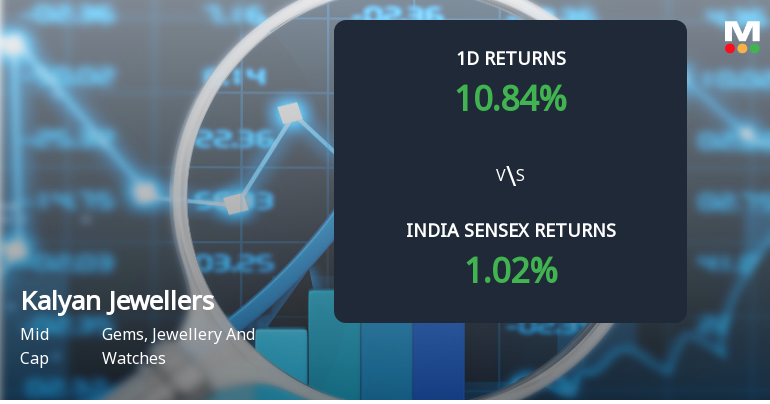
Kalyan Jewellers India Ltd Sees Sharp Open Interest Surge Amid Strong Market Momentum
Kalyan Jewellers India Ltd has witnessed a significant surge in open interest in its derivatives segment, signalling heightened market activity and shifting investor positioning. The stock outperformed its sector and broader indices, supported by robust volume and rising investor participation, suggesting renewed directional bets in the mid-cap gems and jewellery space.
Read full news article
Kalyan Jewellers Sees Sharp Open Interest Surge Amid Strong Market Momentum
Kalyan Jewellers India Ltd (KALYANKJIL) has witnessed a significant surge in open interest in its derivatives segment, signalling increased investor interest and potential directional bets. The stock outperformed its sector and broader indices, supported by rising volumes and improving market positioning, prompting a recent upgrade in its Mojo Grade to Hold from Sell.
Read full news article Announcements
Announcement under Regulation 30 (LODR)-Analyst / Investor Meet - Intimation
30-May-2026 | Source : BSEInvestor Meet
Compliances-Reg.24(A)-Annual Secretarial Compliance
13-May-2026 | Source : BSEAnnual Secretarial Compliance Report for the Year ended 31st March 2026
Announcement under Regulation 30 (LODR)-Earnings Call Transcript
11-May-2026 | Source : BSEEarnings Call Transcript - Q4
Corporate Actions

No Upcoming Board Meetings

Kalyan Jewellers India Ltd has declared 15% dividend, ex-date: 04 Sep 25

No Splits history available

No Bonus history available

No Rights history available
Quality key factors
Valuation key factors
Technicals key factors
 Technical Indicator Scale: Bearish, Mildly Bearish, Sideways, Mildly Bullish, Bullish Turned
 Shareholding Snapshot : Mar 2026
Shareholding Compare (%holding)
Promoters
24.8485
Held by 33 Schemes (13.63%)
Held by 483 FIIs (14.55%)
Kalyanaraman T S (22.37%)
Motilal Oswal Midcap Fund (9.38%)
7.08%
Quarterly Results Snapshot (Consolidated) - Mar'26 - QoQ

QoQ Growth in quarter ended Mar 2026 is -0.66% vs 31.66% in Dec 2025
QoQ Growth in quarter ended Mar 2026 is -1.63% vs 59.80% in Dec 2025
Half Yearly Results Snapshot (Consolidated) - Sep'25
Growth in half year ended Sep 2025 is 30.37% vs 31.97% in Sep 2024

Growth in half year ended Sep 2025 is 70.12% vs 10.47% in Sep 2024
Nine Monthly Results Snapshot (Consolidated) - Dec'25
YoY Growth in nine months ended Dec 2025 is 34.90% vs 34.72% in Dec 2024
YoY Growth in nine months ended Dec 2025 is 78.47% vs 14.67% in Dec 2024
Annual Results Snapshot (Consolidated) - Mar'26
YoY Growth in year ended Mar 2026 is 42.71% vs 35.27% in Mar 2025
YoY Growth in year ended Mar 2026 is 88.92% vs 19.66% in Mar 2025
About Kalyan Jewellers India Ltd

Company Coordinates


