
Compare Rolex Rings with Similar Stocks
Dashboard
High Management Efficiency with a high ROE of 20.86%
Company has a Debt to Equity ratio (avg) of 0.09 times
Poor long term growth as Net Sales has grown by an annual rate of 13.16% and Operating profit at 18.27% over the last 5 years
Negative results in Mar 26
With ROE of 15.8, it has a Expensive valuation with a 3.3 Price to Book Value
Reducing Promoter Confidence
Consistent Underperformance against the benchmark over the last 3 years
Stock DNA
Auto Components & Equipments
INR 4,017 Cr (Small Cap)
21.00
49
0.00%
-0.30
15.83%
3.32
Total Returns (Price + Dividend) 
Rolex Rings for the last several years.
Risk Adjusted Returns v/s
Returns Beta

News
Rolex Rings Ltd is Rated Hold by MarketsMOJO
Rolex Rings Ltd is rated 'Hold' by MarketsMOJO, with this rating last updated on 21 April 2026. However, the analysis and financial metrics discussed here reflect the stock’s current position as of 29 June 2026, providing investors with an up-to-date view of the company’s performance and outlook.
Read full news article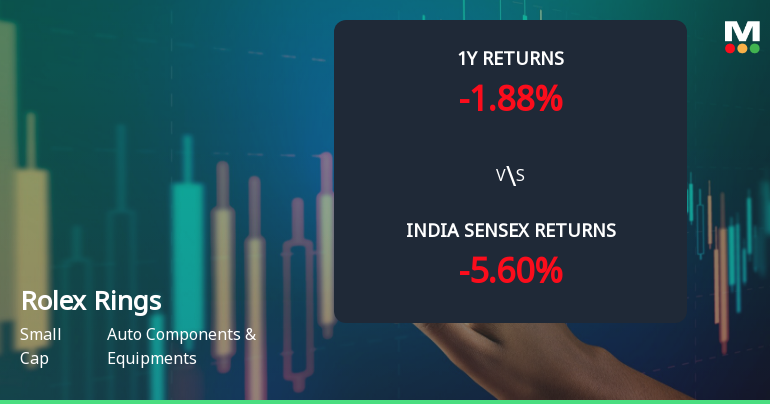
Rolex Rings Ltd Technical Momentum Shifts Signal Bullish Outlook
Rolex Rings Ltd has demonstrated a notable shift in its technical momentum, moving from a mildly bullish stance to a more confident bullish trend. This transition is underscored by a mix of technical indicators, including MACD, RSI, moving averages, and Bollinger Bands, suggesting a positive outlook for the small-cap auto components player amid a mixed market backdrop.
Read full news article
Rolex Rings Ltd is Rated Hold
Rolex Rings Ltd is rated 'Hold' by MarketsMOJO, with this rating last updated on 21 April 2026. However, the analysis and financial metrics discussed here reflect the stock's current position as of 18 June 2026, providing investors with an up-to-date view of the company's performance and outlook.
Read full news article Announcements
Announcement under Regulation 30 (LODR)-Credit Rating
19-Jun-2026 | Source : BSEIntimation of Credit Rating by IndiaRatings & Research
Announcement under Regulation 30 (LODR)-Analyst / Investor Meet - Intimation
16-Jun-2026 | Source : BSEIntimation of Analyst Meet
Announcement under Regulation 30 (LODR)-Analyst / Investor Meet - Intimation
16-Jun-2026 | Source : BSEIntimation of Analyst Meet
Corporate Actions

No Upcoming Board Meetings

No Dividend history available

Rolex Rings Ltd has announced 1:10 stock split, ex-date: 17 Oct 25

No Bonus history available

No Rights history available
Quality key factors
Valuation key factors
Technicals key factors
 Technical Indicator Scale: Bearish, Mildly Bearish, Sideways, Mildly Bullish, Bullish Turned
 Shareholding Snapshot : Mar 2026
Shareholding Compare (%holding)
Promoters
5.4827
Held by 14 Schemes (28.76%)
Held by 33 FIIs (6.01%)
Rupesh Dayashankar Madeka (10.0%)
Icici Prudential Flexicap Fund (6.75%)
9.98%
Quarterly Results Snapshot (Standalone) - Mar'26 - QoQ

QoQ Growth in quarter ended Mar 2026 is 11.22% vs 1.27% in Dec 2025

QoQ Growth in quarter ended Mar 2026 is -100.31% vs 7.69% in Dec 2025
Half Yearly Results Snapshot (Standalone) - Sep'25
Growth in half year ended Sep 2025 is -7.87% vs -3.33% in Sep 2024
Growth in half year ended Sep 2025 is -5.73% vs 3.95% in Sep 2024
Nine Monthly Results Snapshot (Standalone) - Dec'25
YoY Growth in nine months ended Dec 2025 is -3.80% vs -3.81% in Dec 2024
YoY Growth in nine months ended Dec 2025 is 18.33% vs -9.86% in Dec 2024
Annual Results Snapshot (Standalone) - Mar'26
YoY Growth in year ended Mar 2026 is -0.98% vs -5.48% in Mar 2025
YoY Growth in year ended Mar 2026 is -18.91% vs 11.51% in Mar 2025
About Rolex Rings Ltd

Company Coordinates


