
Compare Jamna Auto Inds. with Similar Stocks
Dashboard
Strong Long Term Fundamental Strength with an average Return on Equity (ROE) of 20.76%
- Healthy long term growth as Operating profit has grown by an annual rate 28.19%
- Company has a Debt to Equity ratio (avg) of 0.07 times
With a growth in Net Profit of 73.43%, the company declared Very Positive results in Mar 26
With ROE of 20.9, it has a Attractive valuation with a 4.3 Price to Book Value
Increasing Participation by Institutional Investors
Market Beating Performance
Stock DNA
Auto Components & Equipments
INR 4,694 Cr (Small Cap)
20.00
35
1.82%
-0.08
20.86%
4.00
Total Returns (Price + Dividend) 
Latest dividend: 1 per share ex-dividend date: Nov-19-2025
Risk Adjusted Returns v/s
Returns Beta

News

Jamna Auto Industries Ltd is Rated Strong Buy
Jamna Auto Industries Ltd is rated Strong Buy by MarketsMOJO, with this rating last updated on 29 May 2026. However, the analysis and financial metrics discussed here reflect the company’s current position as of 04 June 2026, providing investors with the latest insights into its fundamentals, valuation, financial trends, and technical outlook.
Read full news article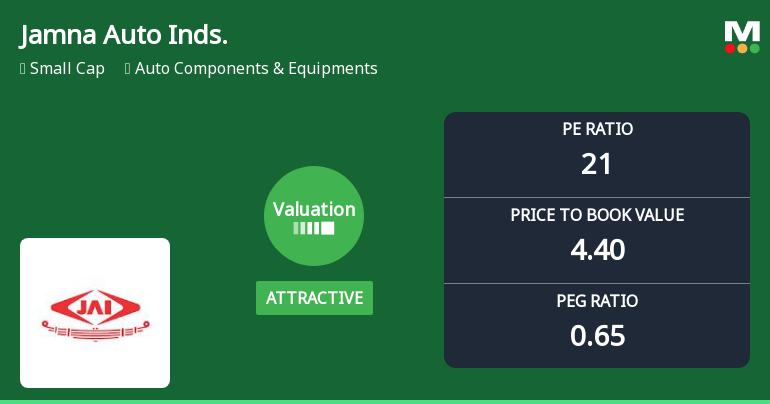
Jamna Auto Industries Ltd Valuation Shifts Signal Enhanced Price Attractiveness
Jamna Auto Industries Ltd has recently undergone a significant shift in its valuation parameters, moving from a fair to an attractive rating. This change, coupled with robust financial metrics and favourable peer comparisons, positions the company as a compelling prospect within the Auto Components & Equipments sector.
Read full news articleAre Jamna Auto Industries Ltd latest results good or bad?
Jamna Auto Industries Ltd's latest financial results for the quarter ending March 2026 reflect a significant operational turnaround, showcasing strong growth across key metrics. The company reported net sales of ₹839.60 crores, marking a year-on-year growth of 31.66%, compared to a decline in the same quarter last year. This robust revenue performance indicates the company's ability to capture market share and enhance operational efficiency within the auto components sector. Net profit for the quarter reached ₹87.27 crores, representing a substantial year-on-year increase of 73.43%. This growth in profitability is complemented by an operating profit margin of 16.31%, which, while slightly lower than the previous quarter, reflects a notable year-on-year expansion of 321 basis points. The increase in margins suggests effective cost management and a favorable product mix, contributing to the overall profitabi...
Read full news article Announcements
Announcement under Regulation 30 (LODR)-Newspaper Publication
30-May-2026 | Source : BSEPlease find enclosed herewith Newspaper Publication of Audited Financial Results for the quarter and year ended March 31 2026.
Audited Financial Results For The Quarter And Year Ended 31 March 2026.
29-May-2026 | Source : BSEPlease find enclosed.
Board Meeting Outcome for Outcome Of The Board Meeting
29-May-2026 | Source : BSEPlease find enclosed herewith.
Corporate Actions

No Upcoming Board Meetings

Jamna Auto Industries Ltd has declared 100% dividend, ex-date: 19 Nov 25

Jamna Auto Industries Ltd has announced 1:5 stock split, ex-date: 05 Oct 17

No Bonus history available

No Rights history available
Quality key factors
Valuation key factors
Technicals key factors
 Technical Indicator Scale: Bearish, Mildly Bearish, Sideways, Mildly Bullish, Bullish Turned
 Shareholding Snapshot : Mar 2026
Shareholding Compare (%holding)
Promoters
1.5208
Held by 15 Schemes (4.03%)
Held by 92 FIIs (9.25%)
Map Holdings Limited (33.78%)
Paramjit Singh Mann (1.87%)
29.9%
Quarterly Results Snapshot (Consolidated) - Mar'26 - YoY

YoY Growth in quarter ended Mar 2026 is 31.66% vs -0.38% in Mar 2025
YoY Growth in quarter ended Mar 2026 is 73.43% vs -8.12% in Mar 2025
Half Yearly Results Snapshot (Consolidated) - Sep'25
Growth in half year ended Sep 2025 is 3.20% vs -9.53% in Sep 2024
Growth in half year ended Sep 2025 is -0.80% vs -9.96% in Sep 2024
Nine Monthly Results Snapshot (Consolidated) - Dec'25
YoY Growth in nine months ended Dec 2025 is 8.55% vs -8.63% in Dec 2024
YoY Growth in nine months ended Dec 2025 is 10.55% vs -13.70% in Dec 2024
Annual Results Snapshot (Consolidated) - Mar'26
YoY Growth in year ended Mar 2026 is 15.04% vs -6.45% in Mar 2025
YoY Growth in year ended Mar 2026 is 28.09% vs -12.21% in Mar 2025
About Jamna Auto Industries Ltd

Company Coordinates


