
Compare Gretex Corporate with Similar Stocks
Dashboard
Strong Long Term Fundamental Strength with an average Return on Equity (ROE) of 18.46%
Healthy long term growth as Net Sales has grown by an annual rate of 126.70% and Operating profit at 109.28%
With ROE of 7.6, it has a Very Expensive valuation with a 4 Price to Book Value
Despite the size of the company, domestic mutual funds hold only 0% of the company
Consistent Returns over the last 3 years
Stock DNA
Capital Markets
INR 1,010 Cr (Micro Cap)
53.00
21
0.07%
0.06
7.58%
4.10
Total Returns (Price + Dividend) 
Latest dividend: 0.3 per share ex-dividend date: Aug-01-2025
Risk Adjusted Returns v/s
Returns Beta

News

Gretex Corporate Services Ltd Technical Momentum Shifts Signal Bullish Outlook
Gretex Corporate Services Ltd has experienced a notable shift in its technical parameters, moving from a mildly bullish to a bullish trend. Despite a modest decline in the latest session, key indicators such as MACD and moving averages signal strengthening momentum, suggesting potential upside for investors amid mixed signals from other technical tools.
Read full news article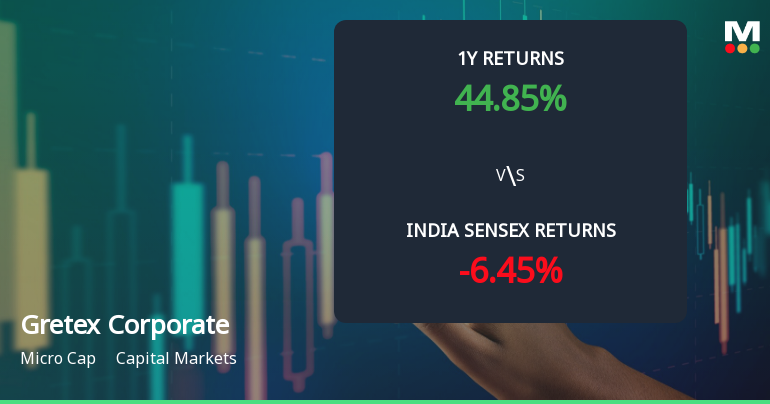
Gretex Corporate Services Ltd: Technical Momentum Shifts Signal Mildly Bullish Outlook
Gretex Corporate Services Ltd, a micro-cap player in the Capital Markets sector, has experienced a notable shift in its technical momentum, transitioning from a bullish to a mildly bullish trend. This change is underscored by a complex interplay of technical indicators, including MACD, RSI, moving averages, and Bollinger Bands, which collectively paint a nuanced picture of the stock’s near-term prospects.
Read full news article
Gretex Corporate Services Ltd is Rated Hold
Gretex Corporate Services Ltd is rated 'Hold' by MarketsMOJO, with this rating last updated on 08 May 2026. However, the analysis and financial metrics discussed here reflect the stock's current position as of 20 June 2026, providing investors with an up-to-date view of its fundamentals, valuation, financial trends, and technical outlook.
Read full news article Announcements
Closure of Trading Window
25-Jun-2026 | Source : BSETrading Window Closure for quarter and three months ended June 30 2026.
General Update.
24-Jun-2026 | Source : BSEThe Company has filed Draft Red Herring Prospectus of Sky Alloys and Power Limited on the Main Board Platforms of National Stock Exchange of India Limited and BSE Limited.
Shareholder Meeting / Postal Ballot-Scrutinizers Report
08-Jun-2026 | Source : BSEResults of Postal Ballot Notice dated May 07 2026.
Corporate Actions

No Upcoming Board Meetings

Gretex Corporate Services Ltd has declared 7% dividend, ex-date: 17 Jul 26

No Splits history available

Gretex Corporate Services Ltd has announced 9:10 bonus issue, ex-date: 09 Apr 25

Gretex Corporate Services Ltd has announced 1:8 rights issue, ex-date: 23 Aug 23
Quality key factors
Valuation key factors
Technicals key factors
 Technical Indicator Scale: Bearish, Mildly Bearish, Sideways, Mildly Bullish, Bullish Turned
 Shareholding Snapshot : Mar 2026
Shareholding Compare (%holding)
Promoters
None
Held by 0 Schemes
Held by 3 FIIs (1.1%)
Bonanza Agency Llp (42.06%)
Anupam Gupta (2.76%)
21.04%
Quarterly Results Snapshot (Consolidated) - Mar'26 - QoQ

QoQ Growth in quarter ended Mar 2026 is -17.41% vs -47.01% in Dec 2025
QoQ Growth in quarter ended Mar 2026 is 201.86% vs -85.94% in Dec 2025
Half Yearly Results Snapshot (Consolidated) - Sep'25

Growth in half year ended Sep 2025 is -23.82% vs 1,070.24% in Sep 2024
Growth in half year ended Sep 2025 is -18.21% vs 429.79% in Sep 2024
Nine Monthly Results Snapshot (Consolidated) - Dec'25
YoY Growth in nine months ended Dec 2025 is -27.79% vs 330.62% in Dec 2024
YoY Growth in nine months ended Dec 2025 is -24.84% vs 139.58% in Dec 2024
Annual Results Snapshot (Consolidated) - Mar'26
YoY Growth in year ended Mar 2026 is -31.04% vs 137.51% in Mar 2025
YoY Growth in year ended Mar 2026 is 1,351.54% vs -95.21% in Mar 2025
About Gretex Corporate Services Ltd

Company Coordinates


