
Compare Shri Venkatesh with Similar Stocks
Dashboard
Low ability to service debt as the company has a high Debt to EBITDA ratio of 10.59 times
- Low ability to service debt as the company has a high Debt to EBITDA ratio of 10.59 times
Poor long term growth as Net Sales has grown by an annual rate of -4.48% and Operating profit at -4.80% over the last 5 years
Flat results in Jun 24
With ROCE of 6.5, it has a Very Expensive valuation with a 2.4 Enterprise value to Capital Employed
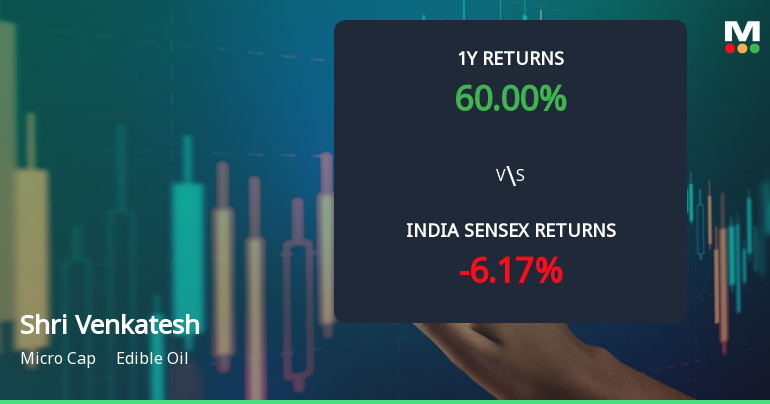
Consistent Returns over the last 3 years
Total Returns (Price + Dividend) 
Latest dividend: 1 per share ex-dividend date: Sep-23-2025
Risk Adjusted Returns v/s
Returns Beta

News
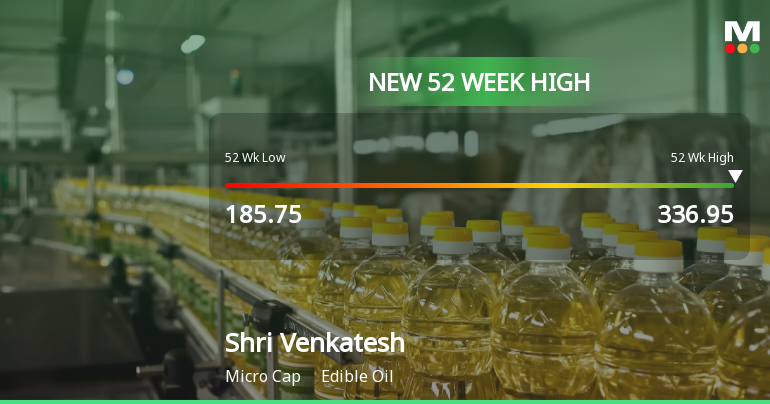
Broad-Based Technical Strength Lifts Shri Venkatesh Refineries Ltd to 52-Week High of Rs 336.95
Surging past its previous peaks, Shri Venkatesh Refineries Ltd touched a new 52-week high of Rs 336.95 on 7 Jul 2026, marking a remarkable 61.22% gain over the past year. This rally has been fuelled by a confluence of strong technical signals and sustained price momentum, setting the stage for a notable breakout in the edible oil sector.
Read full news article
Shri Venkatesh Refineries Ltd Shows Renewed Momentum Amid Technical Upgrades
Shri Venkatesh Refineries Ltd, a micro-cap player in the edible oil sector, has witnessed a notable shift in its technical momentum, moving from a sideways trend to a mildly bullish stance. This transition is underscored by mixed signals from key technical indicators such as MACD, RSI, Bollinger Bands, and moving averages, reflecting a nuanced outlook for investors as the stock edges closer to its 52-week high.
Read full news article Announcements
Board Meeting Outcome for Audited Results For FY 2025-26 Declare Final Dividend For FY 2025-26 & Other Transaction
30-May-2026 | Source : BSEWe would like to inform you that the Board Meeting of the company was held today May 30 2026 which commenced at 6.00 PM and concluded at 9.25 PM The following items were discussed in the meeting:- 1. Considered approved and took on record the Audited Financial Statements (Standalone) of the Company for the Fourth Quarter and Year ended 31st March 2026. 2. Recommended Rs 1 per share as Final Dividend for the Financial Year 2025-2026 subject to the approval of Members in the Annual General Meeting. 3. Approved Related Party Transaction for the Financial Year 2026-27. 4. Transacted other business as may be deemed necessary with the permission of the Chair. The Exchange is further requested to record the same on your records and inform the stakeholders accordingly. Thanking you
Financial Results March 31 2026
30-May-2026 | Source : BSEDear Sir We would like to inform you that Board approved the Financial Results for Financial Year ending March 31 2026.
Board Meeting Intimation for Audited Results For Year Ended 31St March 2026
26-May-2026 | Source : BSEShri Venkatesh Refineries Ltdhas informed BSE that the meeting of the Board of Directors of the Company is scheduled on 30/05/2026 inter alia to consider and approve a) to consider approve and take on record the Audited Financial Statements (Standalone) of the Company for the Fourth Quarter and Year ended 31st March 2026. b) to consider and recommend Final Dividend if any for the Financial Year 2025-2026. c) Any other General matter. The Exchange is further requested to record the same on your records and inform the stakeholders accordingly. Thanking you
Corporate Actions

No Upcoming Board Meetings

Shri Venkatesh Refineries Ltd has declared 10% dividend, ex-date: 23 Sep 25

No Splits history available

Shri Venkatesh Refineries Ltd has announced 1:1 bonus issue, ex-date: 27 Oct 23

No Rights history available
Quality key factors
Valuation key factors
Technicals key factors
 Technical Indicator Scale: Bearish, Mildly Bearish, Sideways, Mildly Bullish, Bullish Turned
 Shareholding Snapshot : Mar 2026
Shareholding Compare (%holding)
Promoters
None
Held by 0 Schemes
Held by 0 FIIs
Dinesh Ganapati Kabre . (18.68%)
Kamlesh Ashok Ladhe (5.12%)
19.3%
Quarterly Results Snapshot (Standalone) - Jun'24 - QoQ

QoQ Growth in quarter ended Jun 2024 is 1.14% vs 31.20% in Mar 2024

QoQ Growth in quarter ended Jun 2024 is 3.75% vs -16.59% in Mar 2024
Half Yearly Results Snapshot (Standalone) - Mar'26
Growth in half year ended Mar 2026 is 47.82% vs 41.33% in Sep 2025
Growth in half year ended Mar 2026 is 65.28% vs 32.47% in Sep 2025
Nine Monthly Results Snapshot (Standalone) - Jun'24
YoY Growth in nine months ended Jun 2024 is 52.27% vs 15.00% in Jun 2024
YoY Growth in nine months ended Jun 2024 is 66.51% vs -6.49% in Jun 2024
Annual Results Snapshot (Standalone) - Mar'26
YoY Growth in year ended Mar 2026 is 96.34% vs 21.98% in Mar 2025
YoY Growth in year ended Mar 2026 is 111.28% vs 20.29% in Mar 2025
About Shri Venkatesh Refineries Ltd

Company Coordinates


