
Compare Sundrop Brands with Similar Stocks
Dashboard
Weak Long Term Fundamental Strength with a -9.72% CAGR growth in Operating Profits over the last 5 years
- The company has been able to generate a Return on Equity (avg) of 2.89% signifying low profitability per unit of shareholders funds
With ROE of 1.4, it has a Expensive valuation with a 1.6 Price to Book Value
100% of Promoter Shares are Pledged
Below par performance in long term as well as near term
Total Returns (Price + Dividend) 
Latest dividend: 3 per share ex-dividend date: Sep-20-2024
Risk Adjusted Returns v/s
Returns Beta

News
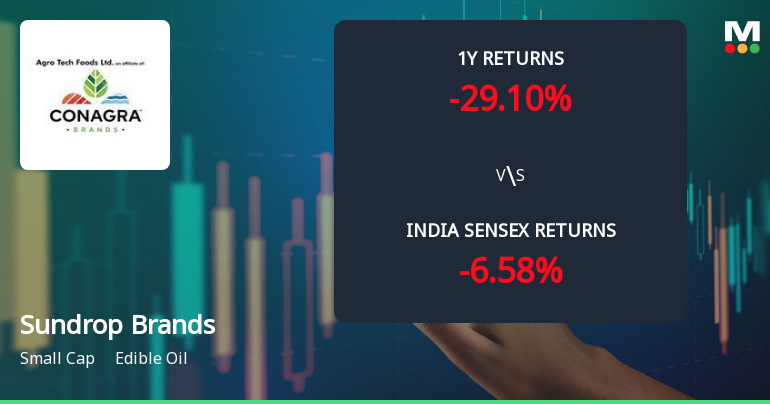
Sundrop Brands Ltd Faces Bearish Momentum Amid Technical Downturn
Sundrop Brands Ltd, a small-cap player in the edible oil sector, has experienced a notable shift in its technical momentum, with key indicators signalling a bearish trend. Despite some mildly bullish signals on weekly charts, the overall technical landscape has deteriorated, prompting a downgrade in its Mojo Grade to Strong Sell as of 17 June 2026.
Read full news article
Sundrop Brands Ltd is Rated Strong Sell
Sundrop Brands Ltd is rated Strong Sell by MarketsMOJO, with this rating last updated on 17 June 2026. However, the analysis and financial metrics discussed here reflect the stock’s current position as of 29 June 2026, providing investors with the latest insights into the company’s performance and outlook.
Read full news article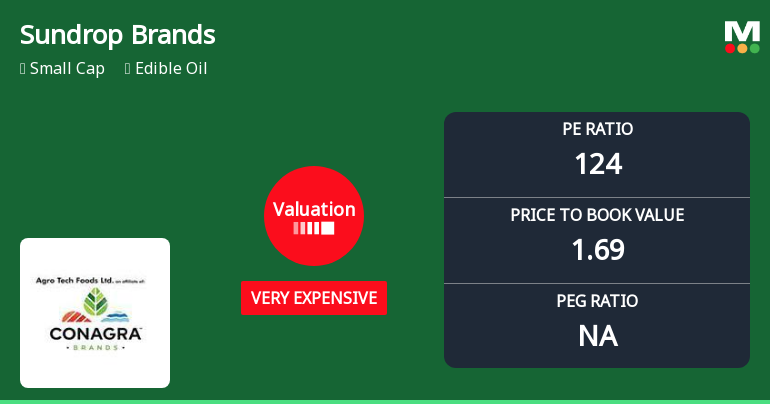
Sundrop Brands Ltd Valuation Shifts Signal Heightened Price Risk Amid Sector Challenges
Sundrop Brands Ltd, a key player in the edible oil sector, has witnessed a marked shift in its valuation parameters, moving from an expensive to a very expensive rating. Despite a modest day gain of 1.35%, the company’s price-to-earnings (P/E) ratio has surged to 124.22, significantly outpacing its peers and historical averages, raising questions about its price attractiveness in the current market environment.
Read full news article Announcements
Agro Tech Foods Limited - Analysts/Institutional Investor Meet/Con. Call Updates
25-Oct-2019 | Source : NSEAgro Tech Foods Limited has informed the Exchange regarding Analysts/Institutional Investor Meet/Con. Call Updates
Shareholders meeting
19-Jul-2019 | Source : NSE
| Agro Tech Foods Limited has submitted the Exchange a copy Srutinizers report of Annual General Meeting held on July 17, 2019. Further, the company has informed the Exchange regarding voting results. |
Analysts\/Institutional Investor Meet\/Con. Call Updates
18-Jul-2019 | Source : NSE
| Agro Tech Foods Limited has informed the Exchange regarding Analysts/Institutional Investor Meet/Con. Call Updates |
Corporate Actions

No Upcoming Board Meetings

Sundrop Brands Ltd has declared 30% dividend, ex-date: 20 Sep 24

No Splits history available

No Bonus history available

No Rights history available
Quality key factors
Valuation key factors
Technicals key factors
 Technical Indicator Scale: Bearish, Mildly Bearish, Sideways, Mildly Bullish, Bullish Turned
 Shareholding Snapshot : Mar 2026
Shareholding Compare (%holding)
Non Institution
100
Held by 3 Schemes (4.92%)
Held by 7 FIIs (0.23%)
Cag Tech Mauritius Limited (33.92%)
Dmpl India Limited (14.39%)
18.38%
Quarterly Results Snapshot (Consolidated) - Mar'26 - QoQ

QoQ Growth in quarter ended Mar 2026 is -5.13% vs 6.31% in Dec 2025
QoQ Growth in quarter ended Mar 2026 is 22.21% vs 485.65% in Dec 2025
Half Yearly Results Snapshot (Consolidated) - Sep'25

Growth in half year ended Sep 2025 is 95.35% vs -0.45% in Sep 2024
Growth in half year ended Sep 2025 is 788.00% vs -96.10% in Sep 2024
Nine Monthly Results Snapshot (Consolidated) - Dec'25
YoY Growth in nine months ended Dec 2025 is 95.44% vs 2.36% in Dec 2024
YoY Growth in nine months ended Dec 2025 is 147.12% vs -53.42% in Dec 2024
Annual Results Snapshot (Consolidated) - Mar'26
YoY Growth in year ended Mar 2026 is 72.38% vs 18.32% in Mar 2025
YoY Growth in year ended Mar 2026 is 118.32% vs -1,155.62% in Mar 2025
About Sundrop Brands Ltd

Company Coordinates


