
Compare Promax Power with Similar Stocks
Dashboard
Weak Long Term Fundamental Strength as the company has not declared results in the last 6 months
- Poor long term growth as Net Sales has grown by an annual rate of 13.90% over the last 5 years
- Company's ability to service its debt is weak with a poor EBIT to Interest (avg) ratio of 1.57
Flat results in Mar 23
Below par performance in long term as well as near term
Total Returns (Price + Dividend) 
Promax Power for the last several years.
Risk Adjusted Returns v/s
Returns Beta

News
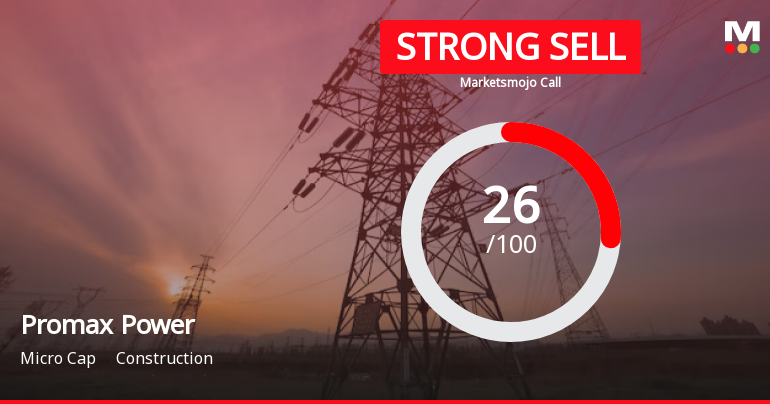
Promax Power Ltd is Rated Strong Sell
Promax Power Ltd is rated Strong Sell by MarketsMOJO, with this rating last updated on 08 Nov 2024. However, the analysis and financial metrics discussed here reflect the stock’s current position as of 19 June 2026, providing investors with an up-to-date perspective on the company’s fundamentals, valuation, financial trend, and technical outlook.
Read full news article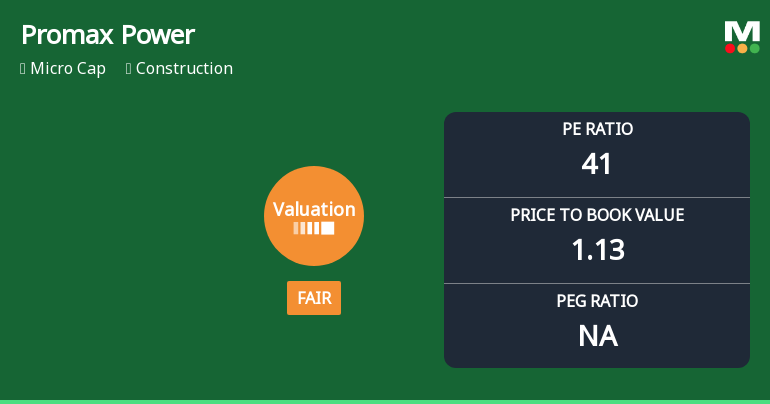
Promax Power Ltd Valuation Shifts Signal Changing Market Sentiment
Promax Power Ltd, a micro-cap player in the construction sector, has experienced a notable shift in its valuation parameters, moving from an attractive to a fair valuation grade. Despite a recent 7.62% surge in its share price to ₹13.99, the company’s price-to-earnings (P/E) ratio now stands at a lofty 40.67, raising questions about its price attractiveness relative to historical levels and peer benchmarks.
Read full news article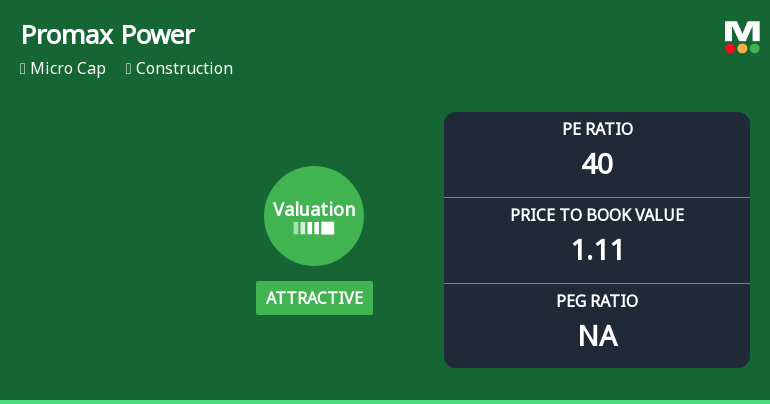
Promax Power Ltd Valuation Shifts to Attractive Amid Steep Price Declines
Promax Power Ltd has witnessed a notable shift in its valuation parameters, moving from a risky to an attractive valuation grade despite ongoing market headwinds and a sharp decline in share price. This article analyses the recent changes in key valuation metrics such as price-to-earnings (P/E) and price-to-book value (P/BV) ratios, comparing them with historical averages and peer benchmarks to assess the stock’s price attractiveness and investment potential.
Read full news article Announcements
Results - Financial Results For March 31 2026
30-May-2026 | Source : BSEResults- Audited Standalone Financial Results for the half year and year ended on 31st March 2026 along with Auditors report thereon.
Board Meeting Outcome for Board Meeting Outcome For Outcome Of Board Meeting And Submission Of Audited Standalone Financial Results For The Half Year And Year Ended On 31St March 2026
30-May-2026 | Source : BSEThe Board of Directors in their meeting held today have approved the Audited Standalone Financial Results for the half year and year ended on 31st March 2026. Pursuant to Regulation 33 of SEBI (LODR) Regulations 2015 we are enclosing herewith: 1. Statement of Audited Financial Results for the year ended on 31st March 2026. 2. Auditors Report on the Audited Financial Results 3. Declaration to the effect that there is Unmodified Opinion with respect to Audited Standalone Financial Results for the half year and year ended on 31st March 2026.
Board Meeting Intimation for Board Meeting For Consideration Of Standalone Audited Financial Results For The Financial Year 2025-26 Ended On 31St March 2026
27-May-2026 | Source : BSEPromax Power Ltdhas informed BSE that the meeting of the Board of Directors of the Company is scheduled on 30/05/2026 inter alia to consider and approve Standalone Audited Financial Results for the Financial Year 2025-26 ended on 31st March 2026
Corporate Actions

No Upcoming Board Meetings

No Dividend history available

No Splits history available

Promax Power Ltd has announced 1:1 bonus issue, ex-date: 08 Apr 24

No Rights history available
Quality key factors
Valuation key factors
Technicals key factors
 Technical Indicator Scale: Bearish, Mildly Bearish, Sideways, Mildly Bullish, Bullish Turned
 Shareholding Snapshot : Mar 2026
Shareholding Compare (%holding)
Promoters
None
Held by 0 Schemes
Held by 0 FIIs
Vishal Bhardwaj (32.62%)
Hemanth Kumar Chebrolu (5.27%)
22.34%
Quarterly Results Snapshot (Standalone) - Mar'23 - QoQ
Not Applicable: The company has declared_date for only one period
Not Applicable: The company has declared_date for only one period
Half Yearly Results Snapshot (Standalone) - Mar'26

Growth in half year ended Mar 2026 is -5.31% vs -2.02% in Sep 2025
Growth in half year ended Mar 2026 is -169.12% vs 27.10% in Sep 2025
Nine Monthly Results Snapshot (Consolidated) - Mar'23

YoY Growth in nine months ended Mar 2023 is 12.53% vs 1.90% in Mar 2023
YoY Growth in nine months ended Mar 2023 is -19.48% vs 50.98% in Mar 2023
Annual Results Snapshot (Standalone) - Mar'26
YoY Growth in year ended Mar 2026 is 6.49% vs 10.22% in Mar 2025
YoY Growth in year ended Mar 2026 is -63.25% vs 70.80% in Mar 2025
About Promax Power Ltd

Company Coordinates


