
Compare Sigachi Indust. with Similar Stocks
Stock DNA
Pharmaceuticals & Biotechnology
INR 879 Cr (Micro Cap)
24.00
35
0.43%
0.22
6.99%
1.68
Total Returns (Price + Dividend) 
Latest dividend: 0.09999999999999999 per share ex-dividend date: Sep-16-2025
Risk Adjusted Returns v/s
Returns Beta

News

Sigachi Industries Ltd is Rated Sell
Sigachi Industries Ltd is rated 'Sell' by MarketsMOJO, with this rating last updated on 01 June 2026. However, the analysis and financial metrics discussed here reflect the stock's current position as of 04 July 2026, providing investors with the latest insights into the company’s performance and outlook.
Read full news article
Sigachi Industries Ltd Locks at Upper Circuit With 4.98% Gain — Buyers Queue, Sellers Absent
At Rs 25.29, the buying was done — not because demand dried up, but because the exchange wouldn't let the stock go any higher. Sigachi Industries Ltd locked at its upper circuit of 4.98% on 23 Jun 2026, with buyers queuing and no sellers willing to part with shares.
Read full news article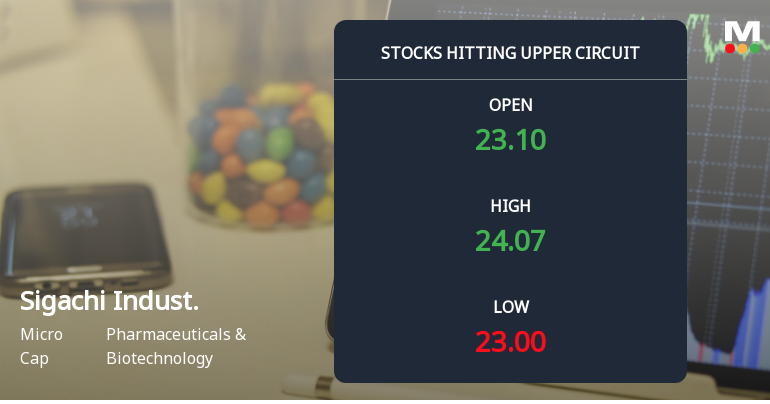
Sigachi Industries Ltd Locks at Upper Circuit With 4.97% Gain — Buyers Queue, Sellers Absent
At Rs 24.09, the buying was done — not because demand dried up, but because the exchange wouldn't let the stock go any higher. Sigachi Industries Ltd locked at its upper circuit of 4.97% on 22 Jun 2026, with buyers queuing and no sellers willing to part with shares.
Read full news article Announcements
Closure of Trading Window
25-Jun-2026 | Source : BSETrading Window-Closure
Announcement under Regulation 30 (LODR)-Earnings Call Transcript
05-Jun-2026 | Source : BSETranscript of Earnings call Q4 FY 2025-26
Announcement under Regulation 30 (LODR)-Newspaper Publication
01-Jun-2026 | Source : BSENewspaper Publication
Corporate Actions

No Upcoming Board Meetings

Sigachi Industries Ltd has declared 10% dividend, ex-date: 16 Sep 25

Sigachi Industries Ltd has announced 1:10 stock split, ex-date: 09 Oct 23

No Bonus history available

No Rights history available
Quality key factors
Valuation key factors
Technicals key factors
 Technical Indicator Scale: Bearish, Mildly Bearish, Sideways, Mildly Bullish, Bullish Turned
 Shareholding Snapshot : Mar 2026
Shareholding Compare (%holding)
Non Institution
27.7119
Held by 2 Schemes (0.0%)
Held by 12 FIIs (1.3%)
Rps Industries Private Limited (15.02%)
Rakesh Yadav (2.65%)
54.61%
Quarterly Results Snapshot (Consolidated) - Mar'26 - QoQ

QoQ Growth in quarter ended Mar 2026 is 4.00% vs 6.09% in Dec 2025

QoQ Growth in quarter ended Mar 2026 is 3,755.00% vs -98.13% in Dec 2025
Half Yearly Results Snapshot (Consolidated) - Sep'25
Growth in half year ended Sep 2025 is 8.21% vs 19.98% in Sep 2024
Growth in half year ended Sep 2025 is -356.64% vs 34.44% in Sep 2024
Nine Monthly Results Snapshot (Consolidated) - Dec'25
YoY Growth in nine months ended Dec 2025 is -1.14% vs 22.12% in Dec 2024
YoY Growth in nine months ended Dec 2025 is -258.94% vs 33.71% in Dec 2024
Annual Results Snapshot (Consolidated) - Mar'26
YoY Growth in year ended Mar 2026 is -2.13% vs 22.38% in Mar 2025
YoY Growth in year ended Mar 2026 is -217.54% vs 21.65% in Mar 2025
About Sigachi Industries Ltd

Company Coordinates


