Kopran

  • Market Cap: Micro Cap
  • Industry: Pharmaceuticals & Biotechnology
  • ISIN: INE082A01010
  • NSEID: KOPRAN
  • BSEID: 524280
INR
277.75
9.15 (3.41%)
BSENSE

Sep 18, 03:30 PM

BSE+NSE Vol: 25.68 lacs

  • Price Points
  • Score
  • Mojo Parameters
  • Total Return
  • News and Corporate Actions
  • Key factors
  • Shareholding
  • Financials
  • CompanyCV
stock-summaryPrice Point
High/Low

1Day

52 Week

Valuation
Technical
Day's Volume

CASH

25.68 lacs (-65.92%) Volume

Shareholding (Jun 2026)

FII

0.51%

Held by 18 FIIs

DII

0.00%

Held by 0 DIIs

Promoter

44.42%

Why is Kopran Ltd falling/rising?

06-Sep-2026

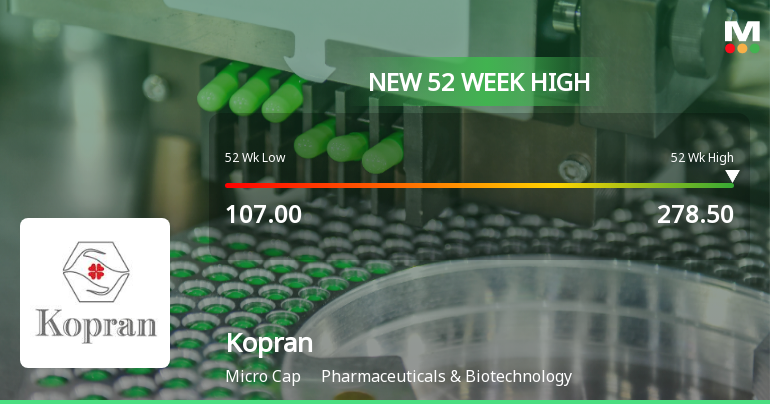
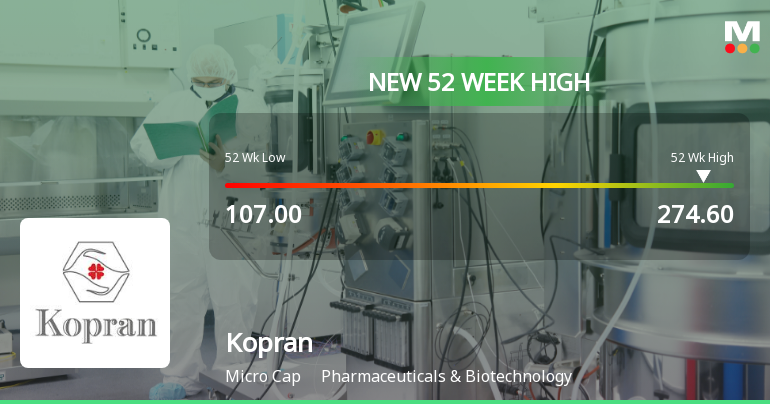
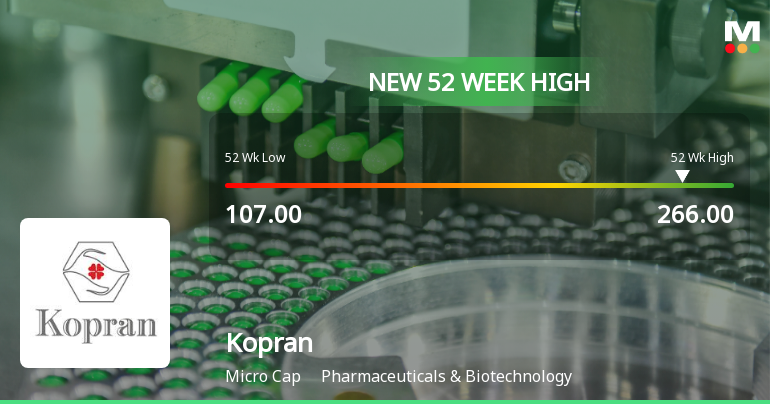
As of 05-Sep, Kopran Ltd's stock price is rising to Rs. 232.70, supported by strong performance indicators including a new 52-week high and significant outperformance against the Sensex. The stock has shown a year-to-date increase of +55.24%, with heightened investor interest reflected in a substantial rise in delivery volume.

As of 05-Sep, Kopran Ltd's stock price is rising, currently at Rs. 232.70, reflecting a change of 0.65 (0.28%) upwards. This upward movement is supported by several factors. Notably, the stock has recently achieved a new 52-week high of Rs. 242.8, indicating strong performance. Over the past week, Kopran has outperformed the Sensex, with a return of +15.63% compared to the benchmark's -0.97%. Similarly, in the last month, the stock has risen by +24.31%, while the Sensex has declined by -2.44%.<BR><BR>Additionally, the stock's performance year-to-date shows a significant increase of +55.24%, contrasting sharply with the Sensex's -10.21% return. This trend is further reinforced by the stock trading above its 5-day, 20-day, 50-day, 100-day, and 200-day moving averages, suggesting a strong bullish trend.<BR><BR>Investor participation has also increased, with a notable rise in delivery volume by 183.88% against the 5-day average, indicating heightened interest in the stock. Despite a recent trend reversal after two days of gains, the overall market-beating performance and attractive valuation metrics, such as a low Debt to EBITDA ratio and a favorable Enterprise value to Capital Employed ratio, contribute to the stock's rising price.

View full answer

Who are in the management team of Kopran?

01-Sep-2026

The management team of Kopran includes Surendra Somani (Executive Vice Chairman), Sunil Sodhani (Company Secretary), and several Independent Directors: Siddhan Subramanian, Sunita Banerji, Mamta Biyani, Narayan Atal. Additionally, Susheel Somani serves as Chairman (Non-Executive), with Adarsh Somani and Varun Somani as Non-Executive Directors.

The management team of Kopran includes the following individuals:<BR><BR>1. Surendra Somani - Executive Vice Chairman<BR>2. Sunil Sodhani - Company Secretary & Compliance Officer<BR>3. Siddhan Subramanian - Independent Director<BR>4. Sunita Banerji - Independent Director<BR>5. Mamta Biyani - Independent Director<BR>6. Narayan Atal - Independent Director<BR>7. Susheel Somani - Chairman (Non-Executive)<BR>8. Adarsh Somani - Non-Executive Director<BR>9. Varun Somani - Non-Executive Director<BR><BR>This team oversees the strategic direction and governance of the company. If you have any more questions about Kopran or its operations, feel free to ask!

View full answer

What does Kopran do?

01-Sep-2026

Kopran Ltd is a micro-cap pharmaceutical and biotechnology company focused on developing and manufacturing Penicillin and non-penicillin-based drugs. As of June 2026, it reported net sales of 154 Cr and a net profit of 7 Cr, with a market cap of INR 1,099 Cr.

Overview:<BR>Kopran Ltd is a pharmaceutical and biotechnology company specializing in the development and manufacturing of Penicillin and non-penicillin-based drugs, categorized as a micro-cap company.<BR><BR>History:<BR>Kopran Ltd was incorporated on April 26, 1958, and is promoted by the Somani group as a part of Parijat Enterprises. The latest quarterly results reported net sales and profit for June 2026.<BR><BR>Financial Snapshot:<BR>Net Sales: 154 Cr (Quarterly Results - Jun 2026) <BR>Net Profit: 7 Cr (Quarterly Results - Jun 2026) <BR>Market Cap: INR 1,099 Cr (Micro Cap)<BR><BR>Key Metrics:<BR>P/E: 42.00 <BR>Industry P/E: 37 <BR>Dividend Yield: 2.98% <BR>Debt-Equity: 0.27 <BR>Return on Equity: 4.85% <BR>Price to Book: 1.83 <BR><BR>Contact Details:<BR>Address: Parijat House 1076, Dr E Moses Road Worli Mumbai Maharashtra : 400018 <BR>Tel: 91-22-43661111 <BR>Email: investors@kopran.com <BR>Website: http://www.kopran.com

View full answer

Who are the peers of the Kopran?

01-Sep-2026

Kopran's peers include Lincoln Pharma, Themis Medicare, Bajaj Healthcare, and others, with varying management and growth risks. Kopran has a 1-year return of 40.77%, outperforming Themis Medicare (26.14%) and Bajaj Healthcare (-21.10%).

Peers: The peers of Kopran are Lincoln Pharma., Themis Medicare, Bajaj Healthcare, Bharat Parenter., Wanbury, Anlon Healthcare, Anuh Pharma, Amanta Healthcar, Remus Pharma.<BR><BR>Quality Snapshot: Excellent management risk is observed at Anlon Healthcare and Anuh Pharma, while Average management risk is found at Lincoln Pharma., Themis Medicare, Bajaj Healthcare, Wanbury, Kopran, and Amanta Healthcar, and the rest. Below Average management risk is present at Bharat Parenter. and the rest. Growth is Excellent at Anlon Healthcare, while Average growth is noted at Lincoln Pharma., Wanbury, Kopran, and the rest. Below Average growth is seen at Themis Medicare, Bajaj Healthcare, Bharat Parenter., Amanta Healthcar, Anuh Pharma, and the rest. Capital Structure is Excellent at Lincoln Pharma., Anuh Pharma, and Remus Pharma., Good at Kopran and Anlon Healthcare, and Below Average at Themis Medicare, Bajaj Healthcare, Bharat Parenter., Wanbury, Amanta Healthcar, and the rest.<BR><BR>Return Snapshot: The peer with the highest 1-year return is Themis Medicare at 26.14%, while Bajaj Healthcare has the lowest at -21.10%. Kopran's own 1-year return is 40.77%, which is significantly higher than both. Additionally, Wanbury has a negative six-month return of 0.75%.

View full answer

How big is Kopran?

01-Sep-2026

As of 31st August, Kopran Ltd has a market capitalization of 1,099.00 Cr, with recent net sales of 700.20 Cr and a net profit of 24.99 Cr. Shareholder's funds are 530.28 Cr, and total assets amount to 908.36 Cr as of March 2026.

As of 31st August, Kopran Ltd has a market capitalization of 1,099.00 Cr, categorizing it as a Micro Cap company.<BR><BR>In the latest four quarters, Kopran reported Net Sales of 700.20 Cr and a Net Profit of 24.99 Cr.<BR><BR>The latest reporting period for the balance sheet is March 2026, with Shareholder's Funds amounting to 530.28 Cr and Total Assets of 908.36 Cr.

View full answer

Should I buy, sell or hold Kopran Ltd?

08-Aug-2026

When is the next results date for Kopran Ltd?

23-Jul-2026

The next results date for Kopran Ltd is August 7, 2026.

The next results date for Kopran Ltd is scheduled for August 7, 2026.

View full answer

Are Kopran Ltd latest results good or bad?

20-May-2026

Kopran Ltd's latest Q4 FY26 results are strong, showing a net profit increase of over 102% quarter-on-quarter and a revenue growth of 35.77% year-on-year. However, concerns about the sustainability of this performance due to past volatility suggest caution for future outlook.

Kopran Ltd's latest results for Q4 FY26 indicate a strong performance, marking a significant recovery from previous quarters. The company reported a net profit of ₹18.87 crores, which is a remarkable increase of 102.03% quarter-on-quarter and 94.94% year-on-year. Additionally, revenue grew by 35.77% compared to the same quarter last year, reaching ₹234.02 crores, the highest in at least eight quarters.<BR><BR>The operating margin also improved significantly to 14.08%, the best performance in two years, reflecting better operational efficiency. However, while these results are encouraging, they come after a period of volatility, including a loss in the previous quarter. <BR><BR>Despite the positive indicators in the latest quarter, there are concerns regarding the sustainability of these improvements, given the company's history of fluctuating performance and modest return on equity. The overall sentiment is mixed; while the recent results are good, the underlying operational challenges and volatility raise questions about long-term stability. Therefore, while the latest results can be seen as good, caution is warranted regarding future performance.

View full answer

How has been the historical performance of Kopran?

13-Nov-2025

Kopran's historical performance shows steady sales growth from INR 359.50 crore in March 2020 to INR 629.60 crore in March 2025, but profitability has declined, with profit after tax dropping from INR 61.61 crore in March 2021 to INR 38.55 crore in March 2025 due to rising costs. Total assets increased significantly, while cash flow from operating activities remained positive.

Answer:<BR>The historical performance of Kopran shows a mixed trend in financial metrics over the years, with notable fluctuations in sales, profits, and expenses.<BR><BR>Breakdown:<BR>Kopran's net sales have shown a steady increase from INR 359.50 crore in March 2020 to INR 629.60 crore in March 2025, reflecting a strong growth trajectory. However, the total operating income also increased correspondingly, reaching INR 629.60 crore in March 2025. The raw material costs have risen significantly, from INR 196.19 crore in March 2019 to INR 401.00 crore in March 2025, indicating rising input costs. Operating profit, excluding other income, peaked at INR 99.76 crore in March 2021 but has since declined to INR 72.89 crore in March 2025. Profit before tax followed a similar pattern, reaching a high of INR 83.34 crore in March 2021 before dropping to INR 51.95 crore in March 2025. Consequently, profit after tax also decreased from INR 61.61 crore in March 2021 to INR 38.55 crore in March 2025. The company's total assets have grown from INR 370.21 crore in March 2020 to INR 844.01 crore in March 2025, while total liabilities increased from INR 370.21 crore to INR 147.79 crore over the same period. Cash flow from operating activities remained positive, with INR 41.00 crore in March 2025, although cash flow from investing activities was negative at INR -56.00 crore. Overall, Kopran's financial performance reflects growth in sales and assets but challenges in maintaining profitability amidst rising costs.

View full answer

Is Kopran technically bullish or bearish?

13-Nov-2025

As of November 12, 2025, Kopran's technical trend has shifted to bearish, supported by negative indicators from MACD, Bollinger Bands, and moving averages, despite a mildly bullish signal from KST on the weekly chart.

As of 12 November 2025, the technical trend for Kopran has changed from mildly bearish to bearish. The current stance is bearish with a strong indication of weakness. The MACD is bearish on both the weekly and monthly time frames, and Bollinger Bands also reflect a bearish outlook. Daily moving averages confirm the bearish trend. Although the KST shows a mildly bullish signal on the weekly, the overall monthly trend remains bearish. Dow Theory indicates a mildly bearish stance on both weekly and monthly charts. The stock has experienced significant declines over various time frames, further supporting the bearish sentiment.

View full answer

Who are the top shareholders of the Kopran?

17-Jul-2025

The top shareholders of Kopran include Oricon Enterprises Limited with 12.88%, individual investors with 42.83%, and Laxminarayan Vyapaar P Ltd at 1.56%. Additionally, there are 29 foreign institutional investors holding 0.76%, and no pledged promoter holdings are reported.

The top shareholders of Kopran include Oricon Enterprises Limited, which holds the highest promoter stake at 12.88%. Additionally, individual investors collectively own 42.83% of the company. Among public shareholders, Laxminarayan Vyapaar P Ltd is notable with a holding of 1.56%. The company also has 29 foreign institutional investors (FIIs) with a combined holding of 0.76%, and there are five mutual fund schemes that hold 0.0%. There are no pledged promoter holdings reported.

View full answer

Is Kopran overvalued or undervalued?

09-Jun-2025

As of February 12, 2025, Kopran is considered fairly valued with a PE Ratio of 24.22 and has underperformed the Sensex with a return of -18.93%, indicating limited growth expectations compared to its peers.

As of 12 February 2025, Kopran's valuation grade has moved from very attractive to attractive, indicating a shift in market perception. The company is currently assessed as fairly valued. Key ratios include a PE Ratio of 24.22, an EV to EBITDA of 15.13, and a Price to Book Value of 1.80, which suggest that while Kopran is priced reasonably compared to its earnings and book value, it may not present a significant discount to peers.<BR><BR>In comparison to its peers, Kopran's PE Ratio is lower than that of Sun Pharma (35.25) and Divi's Lab (79.33), both categorized as expensive, while it is slightly higher than Cipla (22.99) and Dr. Reddy's Labs (19.49), which are also attractive. Notably, Kopran's PEG Ratio is 0.00, indicating no growth expectations priced into the stock, which could be a concern for potential investors. Over the past year, Kopran has underperformed the Sensex, with a return of -18.93% compared to the Sensex's 7.61%, reinforcing the notion that the stock may not be positioned for significant growth in the near term.

View full answer

Has Kopran declared dividend?

06-Jun-2025

Kopran Ltd has declared a 30% dividend, amounting to ₹3 per share, with an ex-date of September 2, 2024. Despite recent price declines, the company has shown positive long-term returns, with a current dividend yield of 1.55%.

Kopran Ltd has declared a 30% dividend.<BR><BR>Dividend Details:<BR>- Percentage announced: 30%<BR>- Amount per share: 3 per share<BR>- Ex-date: 02 Sep 24<BR><BR>Dividend Yield: 1.55%<BR><BR>Total Returns by Period:<BR>In the last 6 months, the price return was -11.22%, with a dividend return of 0%, resulting in a total return of -11.22%.<BR><BR>Over the past year, the price return was -18.86%, the dividend return was 1.26%, leading to a total return of -17.6%.<BR><BR>In the 2-year period, the price return was 8.97%, the dividend return was 3.32%, culminating in a total return of 12.29%.<BR><BR>For the 3-year period, the price return was -13.38%, with a dividend return of 4.89%, resulting in a total return of -8.49%.<BR><BR>In the last 4 years, the price return was -0.42%, the dividend return was 4.99%, leading to a total return of 4.57%.<BR><BR>Over the 5-year period, the price return was 559.45%, with a dividend return of 35.14%, resulting in a total return of 594.59%.<BR><BR>Overall, while Kopran has declared a dividend and has shown positive returns over the long term, recent performance indicates significant declines in price returns, particularly in the shorter time frames. The dividend yield suggests that the company is providing some return to shareholders despite the fluctuations in price.

View full answer
iScoreScore
Click here to find our call on this stock
Strong Sell
Sell
Hold
Buy
Strong Buy

Dashboard

1

Strong ability to service debt as the company has a low Debt to EBITDA ratio of 2.56 times

 
2

Poor long term growth as Operating profit has grown by an annual rate -6.96% of over the last 5 years

 
3

Flat results in Jun 26

4

With ROCE of 6.2, it has a Attractive valuation with a 2.2 Enterprise value to Capital Employed

5

Despite the size of the company, domestic mutual funds hold only 0.01% of the company

6

Market Beating Performance

stock-summaryMojo Parameters

Mojo Parameters

Loading Valuation Snapshot...

Stock DNA

stock-summary
Industry

Pharmaceuticals & Biotechnology

stock-summary
Market cap

INR 1,291 Cr (Micro Cap)

stock-summary
P/E

53.00

stock-summary
Industry P/E

37

stock-summary
Dividend Yield

1.12%

stock-summary
Debt Equity

0.27

stock-summary
Return on Equity

4.85%

stock-summary
Price to Book

2.45

Revenue and Profits:
Net Sales:
154 Cr
(Quarterly Results - Jun 2026)
Net Profit:
7 Cr
stock-summaryTotal Returns
Total Returns (Price + Dividend) stock-summary
Dividend Yield (1.12%)
TimePeriod
Price Return
Dividend Return
Total Return
3 Months
49.85%
1.47%
51.32%
6 Months
135.58%
2.61%
138.19%
1 Year
60.09%
1.64%
61.73%
2 Years
-17.74%
1.81%
-15.93%
3 Years
18.19%
4.09%
22.28%
4 Years
57.81%
7.34%
65.15%
5 Years
32.48%
7.17%
39.65%

Latest dividend: 3.0034482758620684 per share ex-dividend date: Aug-11-2026

Risk Adjusted Returns v/s stock-summary
Returns Beta
Icon
Beta has not been calculated since enough price history is not available
stock-summaryNews & Corporate Actions

Announcements stock-summary

Announcement under Regulation 30 (LODR)-Allotment of ESOP / ESPS

16-Sep-2026 | Source : BSE

Allotment of ESOP Shares

Disclosures under Reg. 29(2) of SEBI (SAST) Regulations 2011

08-Sep-2026 | Source : BSE

The Exchange has received the disclosure under Regulation 29(2) of SEBI (Substantial Acquisition of Shares & Takeovers) Regulations 2011 for United Shippers Ltd

Clarification sought from Kopran Ltd

01-Sep-2026 | Source : BSE

The Exchange has sought clarification from Kopran Ltd on September 01 2026 with reference to Movement in Volume.

The reply is awaited.

Corporate Actions stock-summary

stock-summary
BOARD MEETING

No Upcoming Board Meetings

stock-summary
DIVIDEND

Kopran Ltd has declared 30% dividend, ex-date: 11 Aug 26

stock-summary
SPLITS

No Splits history available

stock-summary
BONUS

No Bonus history available

stock-summary
RIGHTS

No Rights history available

stock-summaryKey Factors

Quality key factors stock-summary

Factor
Value
Sales Growth (5y)
9.43%
EBIT Growth (5y)
-6.96%
EBIT to Interest (avg)
7.61
Debt to EBITDA (avg)
1.77
Net Debt to Equity (avg)
0.27
Sales to Capital Employed (avg)
1.03
Tax Ratio
24.89%
Dividend Payout Ratio
37.57%
Pledged Shares
0
Institutional Holding
0.52%
ROCE (avg)
10.55%
ROE (avg)
8.64%

Valuation key factors

Factor
Value
P/E Ratio
53
Industry P/E
37
Price to Book Value
2.52
EV to EBIT
35.01
EV to EBITDA
24.16
EV to Capital Employed
2.19
EV to Sales
2.11
PEG Ratio
NA
Dividend Yield
1.09%
ROCE (Latest)
6.23%
ROE (Latest)
4.85%

Technicals key factors

Indicator
Weekly
Monthly
MACD
Bullish
Bullish
RSI
No Signal
No Signal
Bollinger Bands
Bullish
Bullish
Moving Averages
Bullish (Daily)
KST
Mildly Bearish
Mildly Bullish
Dow Theory
Mildly Bullish
Mildly Bullish
OBV
Bullish
Bullish
stock-summary Technical Indicator Scale: Bearish, Mildly Bearish, Sideways, Mildly Bullish, Bullish  Turned 
stock-summaryShareholding
Shareholding Snapshot : Jun 2026stock-summary
Shareholding Compare (%holding) stock-summary
Majority shareholders

Non Institution

Pledged Promoter Holdings

None

Mutual Funds

Held by 5 Schemes (0.0%)

FIIs

Held by 18 FIIs (0.51%)

Promoter with highest holding

Oricon Enterprises Limited (12.88%)

Highest Public shareholder

Madhuri Madhusudan Kela (1.72%)

Individual Investors Holdings

44.14%

stock-summaryFinancial
[
  {
    "link": "quarterly",
    "btn_text": "All Quarterly Results",
    "header": "Quarterly Results Snapshot (Consolidated) - Jun'26 - YoY",
    "rhs": [
      {
        "prefix": "Net Sales ",
        "suffix": "YoY Growth in quarter ended Jun 2026 is 13.88% vs -3.03% in Jun 2025",
        "dir": 1
      },
      {
        "prefix": "Consolidated Net Profit ",
        "suffix": "YoY Growth in quarter ended Jun 2026 is -10.07% vs -32.88% in Jun 2025",
        "dir": 1
      }
    ],
    "table": {
      "header": [
        "Jun'26",
        "Jun'25",
        "Change(%)"
      ],
      "body": [
        {
          "field": "Net Sales",
          "val1": "153.99",
          "val2": "135.22",
          "chgp": "13.88%",
          "chgp_class": "positive"
        },
        {
          "field": "Operating Profit (PBDIT) excl Other Income",
          "val1": "15.80",
          "val2": "14.14",
          "chgp": "11.74%",
          "chgp_class": "positive"
        },
        {
          "field": "Interest",
          "val1": "3.28",
          "val2": "2.54",
          "chgp": "29.13%",
          "chgp_class": "negative"
        },
        {
          "field": "Exceptional Items",
          "val1": "0.00",
          "val2": "0.00",
          "chgp": "",
          "chgp_class": "neutral"
        },
        {
          "field": "Consolidate Net Profit",
          "val1": "6.70",
          "val2": "7.45",
          "chgp": "-10.07%",
          "chgp_class": "negative"
        },
        {
          "field": "Operating Profit Margin (Excl OI)",
          "val1": "10.26%",
          "val2": "10.46%",
          "chgp": "-0.20%",
          "chgp_class": "negative"
        }
      ]
    }
  },
  {
    "link": "half-yearly",
    "btn_text": "All Half Yearly Results",
    "header": "Half Yearly Results Snapshot (Consolidated) - Sep'25",
    "rhs": [
      {
        "prefix": "Net Sales ",
        "suffix": " Growth in half year ended Sep 2025 is -13.01% vs 7.94% in Sep 2024",
        "dir": -1
      },
      {
        "prefix": "Consolidated Net Profit ",
        "suffix": " Growth in half year ended Sep 2025 is -113.37% vs 11.73% in Sep 2024",
        "dir": -1
      }
    ],
    "table": {
      "header": [
        "Sep'25",
        "Sep'24",
        "Change(%)"
      ],
      "body": [
        {
          "field": "Net Sales",
          "val1": "253.13",
          "val2": "291.00",
          "chgp": "-13.01%",
          "chgp_class": "negative"
        },
        {
          "field": "Operating Profit (PBDIT) excl Other Income",
          "val1": "11.25",
          "val2": "32.90",
          "chgp": "-65.81%",
          "chgp_class": "negative"
        },
        {
          "field": "Interest",
          "val1": "4.63",
          "val2": "4.42",
          "chgp": "4.75%",
          "chgp_class": "negative"
        },
        {
          "field": "Exceptional Items",
          "val1": "0.00",
          "val2": "0.00",
          "chgp": "",
          "chgp_class": "neutral"
        },
        {
          "field": "Consolidate Net Profit",
          "val1": "-2.47",
          "val2": "18.48",
          "chgp": "-113.37%",
          "chgp_class": "negative"
        },
        {
          "field": "Operating Profit Margin (Excl OI)",
          "val1": "4.44%",
          "val2": "11.31%",
          "chgp": "-6.87%",
          "chgp_class": "negative"
        }
      ]
    }
  },
  {
    "link": "nine-monthly",
    "btn_text": "All Nine Monthly Results",
    "header": "Nine Monthly Results Snapshot (Consolidated) - Dec'25",
    "rhs": [
      {
        "prefix": "Net Sales ",
        "suffix": "YoY Growth in nine months ended Dec 2025 is -2.15% vs 6.70% in Dec 2024",
        "dir": -1
      },
      {
        "prefix": "Consolidated Net Profit ",
        "suffix": "YoY Growth in nine months ended Dec 2025 is -76.21% vs -10.67% in Dec 2024",
        "dir": -1
      }
    ],
    "table": {
      "header": [
        "Dec'25",
        "Dec'24",
        "Change(%)"
      ],
      "body": [
        {
          "field": "Net Sales",
          "val1": "447.41",
          "val2": "457.24",
          "chgp": "-2.15%",
          "chgp_class": "negative"
        },
        {
          "field": "Operating Profit (PBDIT) excl Other Income",
          "val1": "29.02",
          "val2": "52.74",
          "chgp": "-44.98%",
          "chgp_class": "negative"
        },
        {
          "field": "Interest",
          "val1": "7.30",
          "val2": "6.58",
          "chgp": "10.94%",
          "chgp_class": "negative"
        },
        {
          "field": "Exceptional Items",
          "val1": "0.00",
          "val2": "0.00",
          "chgp": "",
          "chgp_class": "neutral"
        },
        {
          "field": "Consolidate Net Profit",
          "val1": "6.87",
          "val2": "28.88",
          "chgp": "-76.21%",
          "chgp_class": "negative"
        },
        {
          "field": "Operating Profit Margin (Excl OI)",
          "val1": "6.49%",
          "val2": "11.53%",
          "chgp": "-5.04%",
          "chgp_class": "negative"
        }
      ]
    }
  },
  {
    "link": "annual",
    "btn_text": "All Annual Results",
    "header": "Annual Results Snapshot (Consolidated) - Mar'26",
    "rhs": [
      {
        "prefix": "Net Sales ",
        "suffix": "YoY Growth in year ended Mar 2026 is 8.23% vs 2.44% in Mar 2025",
        "dir": 1
      },
      {
        "prefix": "Consolidated Net Profit ",
        "suffix": "YoY Growth in year ended Mar 2026 is -33.26% vs -24.35% in Mar 2025",
        "dir": -1
      }
    ],
    "table": {
      "header": [
        "Mar'26",
        "Mar'25",
        "Change(%)"
      ],
      "body": [
        {
          "field": "Net Sales",
          "val1": "681.42",
          "val2": "629.60",
          "chgp": "8.23%",
          "chgp_class": "positive"
        },
        {
          "field": "Operating Profit (PBDIT) excl Other Income",
          "val1": "61.95",
          "val2": "72.89",
          "chgp": "-15.01%",
          "chgp_class": "negative"
        },
        {
          "field": "Interest",
          "val1": "10.47",
          "val2": "9.34",
          "chgp": "12.10%",
          "chgp_class": "negative"
        },
        {
          "field": "Exceptional Items",
          "val1": "0.00",
          "val2": "0.00",
          "chgp": "",
          "chgp_class": "neutral"
        },
        {
          "field": "Consolidate Net Profit",
          "val1": "25.73",
          "val2": "38.55",
          "chgp": "-33.26%",
          "chgp_class": "negative"
        },
        {
          "field": "Operating Profit Margin (Excl OI)",
          "val1": "9.09%",
          "val2": "11.58%",
          "chgp": "-2.49%",
          "chgp_class": "negative"
        }
      ]
    }
  }
]

Quarterly Results Snapshot (Consolidated) - Jun'26 - YoYstock-summary

Jun'26
Jun'25
Change(%)
Net Sales
153.99
135.22
13.88%
Operating Profit (PBDIT) excl Other Income
15.80
14.14
11.74%
Interest
3.28
2.54
29.13%
Exceptional Items
0.00
0.00
Consolidate Net Profit
6.70
7.45
-10.07%
Operating Profit Margin (Excl OI)
10.26%
10.46%
-0.20%
Values in Rs Cr.
Direction Arrows
Net Sales

YoY Growth in quarter ended Jun 2026 is 13.88% vs -3.03% in Jun 2025

Direction Arrows
Consolidated Net Profit

YoY Growth in quarter ended Jun 2026 is -10.07% vs -32.88% in Jun 2025

Half Yearly Results Snapshot (Consolidated) - Sep'25stock-summary

Sep'25
Sep'24
Change(%)
Net Sales
253.13
291.00
-13.01%
Operating Profit (PBDIT) excl Other Income
11.25
32.90
-65.81%
Interest
4.63
4.42
4.75%
Exceptional Items
0.00
0.00
Consolidate Net Profit
-2.47
18.48
-113.37%
Operating Profit Margin (Excl OI)
4.44%
11.31%
-6.87%
Values in Rs Cr.
Direction Arrows
Net Sales

Growth in half year ended Sep 2025 is -13.01% vs 7.94% in Sep 2024

Direction Arrows
Consolidated Net Profit

Growth in half year ended Sep 2025 is -113.37% vs 11.73% in Sep 2024

Nine Monthly Results Snapshot (Consolidated) - Dec'25stock-summary

Dec'25
Dec'24
Change(%)
Net Sales
447.41
457.24
-2.15%
Operating Profit (PBDIT) excl Other Income
29.02
52.74
-44.98%
Interest
7.30
6.58
10.94%
Exceptional Items
0.00
0.00
Consolidate Net Profit
6.87
28.88
-76.21%
Operating Profit Margin (Excl OI)
6.49%
11.53%
-5.04%
Values in Rs Cr.
Direction Arrows
Net Sales

YoY Growth in nine months ended Dec 2025 is -2.15% vs 6.70% in Dec 2024

Direction Arrows
Consolidated Net Profit

YoY Growth in nine months ended Dec 2025 is -76.21% vs -10.67% in Dec 2024

Annual Results Snapshot (Consolidated) - Mar'26stock-summary

Mar'26
Mar'25
Change(%)
Net Sales
681.42
629.60
8.23%
Operating Profit (PBDIT) excl Other Income
61.95
72.89
-15.01%
Interest
10.47
9.34
12.10%
Exceptional Items
0.00
0.00
Consolidate Net Profit
25.73
38.55
-33.26%
Operating Profit Margin (Excl OI)
9.09%
11.58%
-2.49%
Values in Rs Cr.
Direction Arrows
Net Sales

YoY Growth in year ended Mar 2026 is 8.23% vs 2.44% in Mar 2025

Direction Arrows
Consolidated Net Profit

YoY Growth in year ended Mar 2026 is -33.26% vs -24.35% in Mar 2025

stock-summaryCompany CV
About Kopran Ltd stock-summary
stock-summary
Kopran Ltd
Micro Cap
Pharmaceuticals & Biotechnology
Kopran Limited, incorporated on April 26, 1958, was promoted by the Somani group and is a group company of Parijat Enterprises. Company operates in two distinct business verticals. While pharmaceutical formulations production is managed by Kopran Limited, manufacturing of API is operated under Kopran Research Laboratories Limited (KRLL). Company specialise in developing and manufacturing Penicillin and non-penicillin-based drugs.
Company Coordinates stock-summary
Company Details
Parijat House 1076, Dr E Moses Road Worli Mumbai Maharashtra : 400018
stock-summary
Tel: 91-22-43661111
stock-summary
investors@kopran.com
Registrar Details
Bigshare Services Pvt Ltd , E-2 , Ansa Industrial Estate, Saki Vihar Road, Saki Naka, Andheri (E), Mumbai