
Compare DMR Engineering with Similar Stocks
Stock DNA
Commercial Services & Supplies
INR 35 Cr (Micro Cap)
13.00
34
0.11%
0.00
10.46%
2.64
Total Returns (Price + Dividend) 
Latest dividend: 0.1 per share ex-dividend date: Aug-06-2025
Risk Adjusted Returns v/s
Returns Beta

News
DMR Engineering Ltd Valuation Shifts Signal Renewed Price Attractiveness
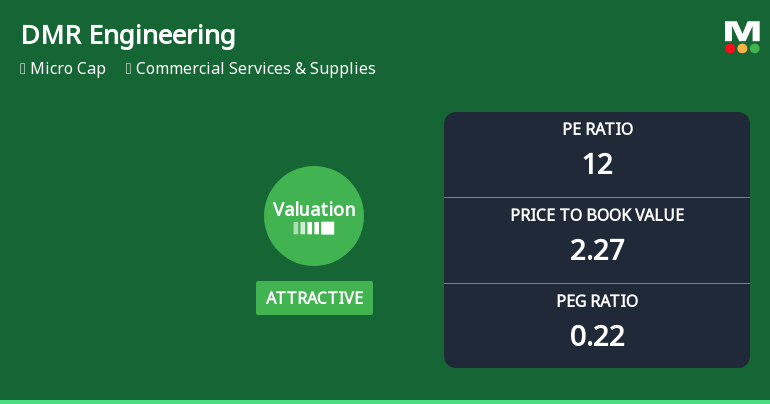
DMR Engineering Ltd, a micro-cap player in the Commercial Services & Supplies sector, has seen a notable shift in its valuation parameters, moving from fair to attractive territory. Despite recent share price declines and a challenging market backdrop, the company’s price-to-earnings (P/E) and price-to-book value (P/BV) ratios now present a compelling case for value-oriented investors, especially when compared with peers and historical averages.
Read full news article
DMR Engineering Ltd is Rated Strong Sell
DMR Engineering Ltd is rated Strong Sell by MarketsMOJO, with this rating last updated on 13 Apr 2026. However, the analysis and financial metrics discussed here reflect the stock’s current position as of 27 May 2026, providing investors with an up-to-date view of the company’s fundamentals, valuation, financial trend, and technical outlook.
Read full news article
DMR Engineering Ltd is Rated Strong Sell
DMR Engineering Ltd is rated Strong Sell by MarketsMOJO. This rating was last updated on 13 Apr 2026, reflecting a reassessment of the stock’s outlook. However, all fundamentals, returns, and financial metrics discussed here are current as of 12 May 2026, providing investors with the latest perspective on the company’s position.
Read full news article Announcements
Announcement under Regulation 30 (LODR)-Newspaper Publication
09-Jun-2026 | Source : BSENewspaper Publication
Reg. 34 (1) Annual Report.
08-Jun-2026 | Source : BSENotice of the 17th Annual General Meeting and Annual Report of the Company for the Financial Year 2025-26
Notice Of The 17Th Annual General Meeting And Annual Report Of The Company For The Financial Year 2025-26
08-Jun-2026 | Source : BSEIntimation of the 17th AGM of the Company for the FY 2025-26
Corporate Actions

No Upcoming Board Meetings

DMR Engineering Ltd has declared 1% dividend, ex-date: 06 Aug 25

No Splits history available

DMR Engineering Ltd has announced 8:5 bonus issue, ex-date: 28 Aug 25

DMR Engineering Ltd has announced 1:20 rights issue, ex-date: 22 Oct 24
Quality key factors
Valuation key factors
Technicals key factors
 Technical Indicator Scale: Bearish, Mildly Bearish, Sideways, Mildly Bullish, Bullish Turned
 Shareholding Snapshot : Mar 2026
Shareholding Compare (%holding)
Promoters
None
Held by 0 Schemes
Held by 0 FIIs
Neelam Mittal (32.68%)
Sharad Kanayalal Shah (1.05%)
26.19%
Quarterly Results Snapshot (Standalone) - Sep'24 - QoQ

QoQ Growth in quarter ended Sep 2024 is 15.72% vs 23.57% in Jun 2024
QoQ Growth in quarter ended Sep 2024 is -19.35% vs 52.46% in Jun 2024
Half Yearly Results Snapshot (Consolidated) - Mar'26
Growth in half year ended Mar 2026 is -33.91% vs 7.55% in Sep 2025
Growth in half year ended Mar 2026 is -122.65% vs 66.06% in Sep 2025
Nine Monthly Results Snapshot (Standalone) - Sep'24

YoY Growth in nine months ended Sep 2024 is 42.31% vs 3.85% in Jun 2024
YoY Growth in nine months ended Sep 2024 is 35.71% vs 24.19% in Jun 2024
Annual Results Snapshot (Consolidated) - Mar'26
YoY Growth in year ended Mar 2026 is 8.95% vs 63.96% in Mar 2025
YoY Growth in year ended Mar 2026 is -23.91% vs 20.26% in Mar 2025
About DMR Engineering Ltd

Company Coordinates


