
Compare DMR Engineering with Similar Stocks
Stock DNA
Commercial Services & Supplies
INR 28 Cr (Micro Cap)
12.00
36
0.48%
0.00
10.46%
2.26
Total Returns (Price + Dividend) 
Latest dividend: 0.1 per share ex-dividend date: Jun-22-2026
Risk Adjusted Returns v/s
Returns Beta

News
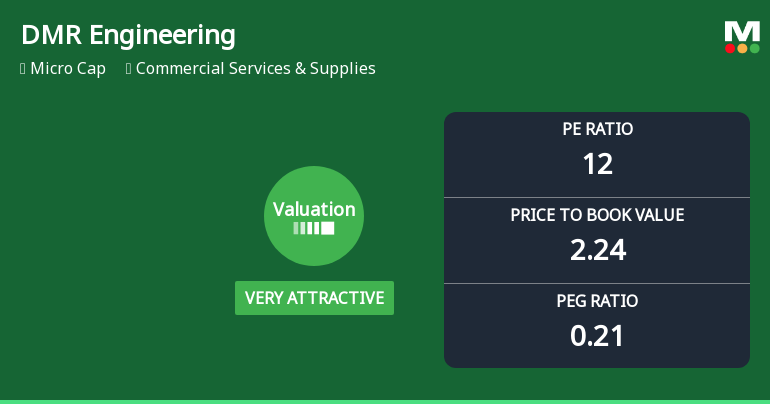
DMR Engineering Ltd Valuation Turns Very Attractive Amid Market Volatility
DMR Engineering Ltd has witnessed a significant improvement in its valuation parameters, shifting from a fair to a very attractive rating. This change comes amid a challenging market backdrop and a notable decline in the stock price, prompting investors to reassess its price attractiveness relative to peers and historical benchmarks.
Read full news article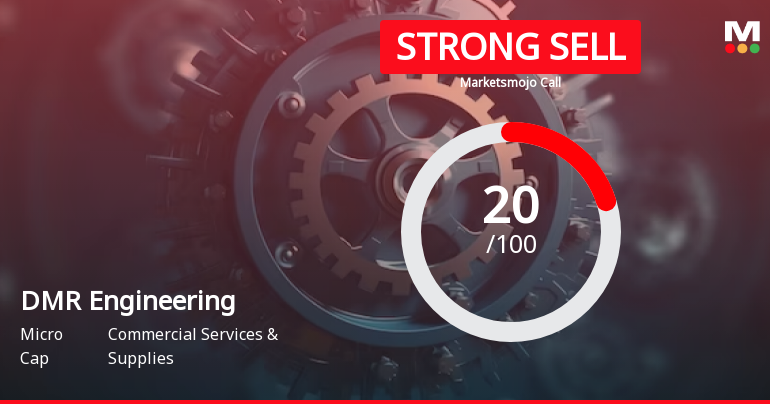
DMR Engineering Ltd is Rated Strong Sell
DMR Engineering Ltd is rated Strong Sell by MarketsMOJO, with this rating last updated on 13 April 2026. However, the analysis and financial metrics presented here reflect the company’s current position as of 03 July 2026, providing investors with the most recent insights into the stock’s performance and outlook.
Read full news article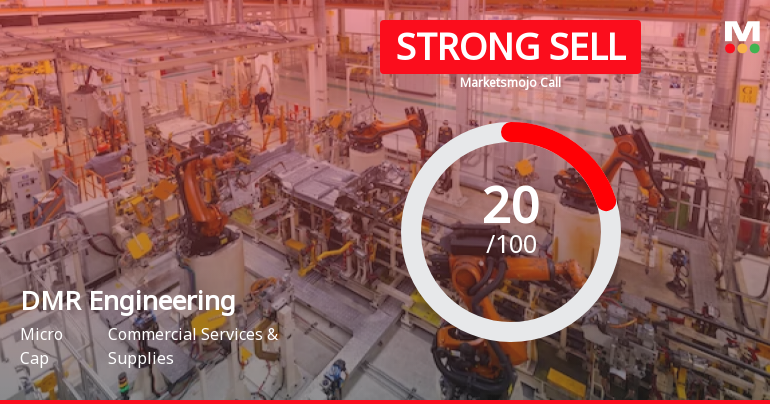
DMR Engineering Ltd is Rated Strong Sell
DMR Engineering Ltd is rated Strong Sell by MarketsMOJO, with this rating last updated on 13 April 2026. However, the analysis below reflects the stock’s current position as of 19 June 2026, incorporating the latest fundamentals, returns, and financial metrics to provide investors with an up-to-date perspective.
Read full news article Announcements
Compliances-Certificate under Reg. 74 (5) of SEBI (DP) Regulations 2018
06-Jul-2026 | Source : BSECertificate under Reg. 74(5) of the SEBI (DP) Regulation 2018
Shareholder Meeting / Postal Ballot-Scrutinizers Report
02-Jul-2026 | Source : BSEPlease find the attached voting results of the 17th AGM of the Company along with the scrutinizer report.
Announcement under Regulation 30 (LODR)-Acquisition
01-Jul-2026 | Source : BSEIntimation for allotment of securities of DM Consulting Engineers Private Limited
Corporate Actions

No Upcoming Board Meetings

DMR Engineering Ltd has declared 1% dividend, ex-date: 22 Jun 26

No Splits history available

DMR Engineering Ltd has announced 8:5 bonus issue, ex-date: 28 Aug 25

DMR Engineering Ltd has announced 1:20 rights issue, ex-date: 22 Oct 24
Quality key factors
Valuation key factors
Technicals key factors
 Technical Indicator Scale: Bearish, Mildly Bearish, Sideways, Mildly Bullish, Bullish Turned
 Shareholding Snapshot : Mar 2026
Shareholding Compare (%holding)
Promoters
None
Held by 0 Schemes
Held by 0 FIIs
Neelam Mittal (32.68%)
Sharad Kanayalal Shah (1.05%)
26.19%
Quarterly Results Snapshot (Standalone) - Sep'24 - QoQ

QoQ Growth in quarter ended Sep 2024 is 15.72% vs 23.57% in Jun 2024
QoQ Growth in quarter ended Sep 2024 is -19.35% vs 52.46% in Jun 2024
Half Yearly Results Snapshot (Consolidated) - Mar'26
Growth in half year ended Mar 2026 is -33.91% vs 7.55% in Sep 2025
Growth in half year ended Mar 2026 is -122.65% vs 66.06% in Sep 2025
Nine Monthly Results Snapshot (Standalone) - Sep'24

YoY Growth in nine months ended Sep 2024 is 42.31% vs 3.85% in Jun 2024
YoY Growth in nine months ended Sep 2024 is 35.71% vs 24.19% in Jun 2024
Annual Results Snapshot (Consolidated) - Mar'26
YoY Growth in year ended Mar 2026 is 8.95% vs 63.96% in Mar 2025
YoY Growth in year ended Mar 2026 is -23.91% vs 20.26% in Mar 2025
About DMR Engineering Ltd

Company Coordinates


