
Compare Metro Brands with Similar Stocks
Dashboard
Poor long term growth as Operating profit has grown by an annual rate 12.55% of over the last 5 years
Flat results in Mar 26
With ROCE of 19.4, it has a Very Expensive valuation with a 10.2 Enterprise value to Capital Employed
Consistent Underperformance against the benchmark over the last 3 years
Total Returns (Price + Dividend) 
Latest dividend: 3.0372182680901543 per share ex-dividend date: Feb-02-2026
Risk Adjusted Returns v/s
Returns Beta

News

Metro Brands Ltd is Rated Sell
Metro Brands Ltd is rated 'Sell' by MarketsMOJO, with this rating last updated on 27 January 2026. However, the analysis and financial metrics discussed below reflect the stock's current position as of 24 June 2026, providing investors with an up-to-date view of the company’s fundamentals, valuation, financial trends, and technical outlook.
Read full news article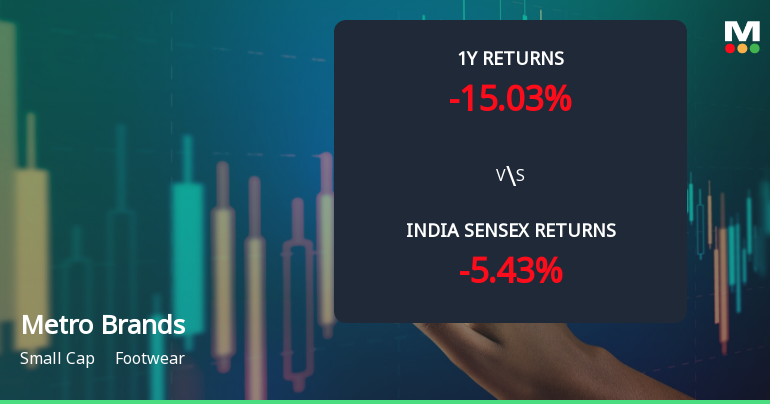
Metro Brands Ltd Technical Momentum Shifts Amid Mixed Market Signals
Metro Brands Ltd has exhibited a nuanced shift in its technical momentum, moving from a bearish stance to a mildly bearish outlook, reflecting a complex interplay of technical indicators. Despite a modest day gain of 1.71%, the stock’s broader trend remains cautious amid mixed signals from key momentum and trend-following tools.
Read full news article
Metro Brands Ltd Technical Momentum Shifts Amid Bearish Sentiment
Metro Brands Ltd, a small-cap player in the footwear sector, has experienced a notable shift in its technical momentum, moving from a mildly bearish to a bearish trend. Despite a marginal day change of 0.09%, the stock’s technical indicators reveal a complex interplay of signals that suggest caution for investors amid broader market pressures and subdued returns relative to the Sensex.
Read full news article Announcements
Announcement under Regulation 30 (LODR)-Change in Management
22-Jun-2026 | Source : BSEChange in Senior Management Personnel.
Announcement under Regulation 30 (LODR)-Analyst / Investor Meet - Outcome
08-Jun-2026 | Source : BSEOutcome of Analyst/Institutional Investor Meet .
Announcement under Regulation 30 (LODR)-Analyst / Investor Meet - Outcome
04-Jun-2026 | Source : BSEOutcome of Analyst/Institutional Investor Meet.
Corporate Actions

No Upcoming Board Meetings

Metro Brands Ltd has declared 60% dividend, ex-date: 02 Feb 26

No Splits history available

No Bonus history available

No Rights history available
Quality key factors
Valuation key factors
Technicals key factors
 Technical Indicator Scale: Bearish, Mildly Bearish, Sideways, Mildly Bullish, Bullish Turned
 Shareholding Snapshot : Mar 2026
Shareholding Compare (%holding)
Promoters
None
Held by 18 Schemes (7.2%)
Held by 84 FIIs (3.77%)
Aziza Malik Family Trust (trustee - Farah Malik Bhanji) (28.05%)
Aryaman Jhunjhunwala Discretionary Trust (trustee - Rekha Rakesh Jhunjhunwala) (4.79%)
16.56%
Quarterly Results Snapshot (Consolidated) - Mar'26 - QoQ

QoQ Growth in quarter ended Mar 2026 is -4.72% vs 24.59% in Dec 2025
QoQ Growth in quarter ended Mar 2026 is -9.15% vs 89.61% in Dec 2025
Half Yearly Results Snapshot (Consolidated) - Sep'25

Growth in half year ended Sep 2025 is 10.15% vs 2.05% in Sep 2024
Growth in half year ended Sep 2025 is 3.06% vs 1.10% in Sep 2024
Nine Monthly Results Snapshot (Consolidated) - Dec'25
YoY Growth in nine months ended Dec 2025 is 12.12% vs 5.12% in Dec 2024
YoY Growth in nine months ended Dec 2025 is 15.13% vs -0.58% in Dec 2024
Annual Results Snapshot (Consolidated) - Mar'26
YoY Growth in year ended Mar 2026 is 14.21% vs 6.39% in Mar 2025
YoY Growth in year ended Mar 2026 is 17.27% vs -15.01% in Mar 2025
About Metro Brands Ltd

Company Coordinates


