
Compare Kesar India with Similar Stocks
Total Returns (Price + Dividend) 
Kesar India for the last several years.
Risk Adjusted Returns v/s
Returns Beta

News

Kesar India Ltd is Rated Hold by MarketsMOJO
Kesar India Ltd is rated 'Hold' by MarketsMOJO, a rating that was established on 09 April 2026. While this rating was set on that date, the analysis and financial metrics discussed here reflect the company’s current position as of 26 June 2026, providing investors with an up-to-date view of the stock’s fundamentals, valuation, financial trends, and technical outlook.
Read full news article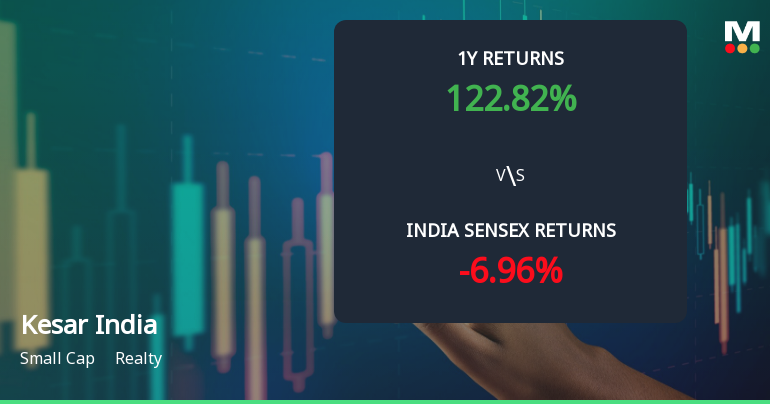
Kesar India Ltd Technical Momentum Shifts Signal Bullish Outlook Amid Realty Sector Recovery
Kesar India Ltd, a small-cap player in the realty sector, has exhibited a notable shift in its technical momentum, moving from a mildly bullish to a bullish trend. Despite mixed signals from key indicators such as MACD, RSI, and moving averages, the stock’s recent price action and technical parameters suggest an improving outlook, warranting close attention from investors and market analysts alike.
Read full news article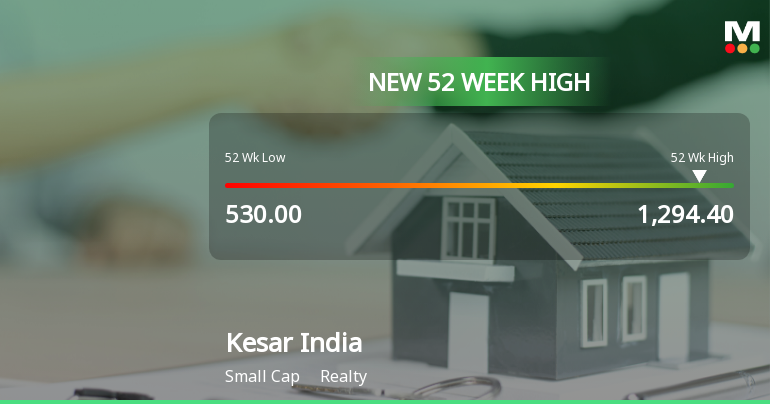
Broad-Based Technical Strength Lifts Kesar India Ltd to 52-Week High of Rs 1294.4
Surging past its previous peak, Kesar India Ltd touched a new 52-week high of Rs 1294.4 on 23 Jun 2026, marking a remarkable 127.58% gain over the past year. This milestone comes amid a backdrop of strong technical momentum and a market environment where the Sensex has been steadily advancing, underscoring the stock’s robust price action.
Read full news article Announcements
Closure of Trading Window
25-Jun-2026 | Source : BSEIntimation of Closure of Trading Window
Intimation Of Cancellation Of Board Meeting Scheduled To Be Held On June 05 2026.
05-Jun-2026 | Source : BSEIntimation of cancellation of Board meeting scheduled to be held on June 05 2026.
Announcement under Regulation 30 (LODR)-Allotment
04-Jun-2026 | Source : BSEOutcome of meeting of Preferential Issue Committee of the Board of Directors of Kesar India Limited (the Company) in accordance with the provisions of Regulation 30 of Securities and Exchange Board of India (Listing Obligations and Disclosure Requirements) Regulations 2015.
Corporate Actions

No Upcoming Board Meetings

No Dividend history available

No Splits history available

Kesar India Ltd has announced 6:1 bonus issue, ex-date: 19 Mar 24

No Rights history available
Quality key factors
Valuation key factors
Technicals key factors
 Technical Indicator Scale: Bearish, Mildly Bearish, Sideways, Mildly Bullish, Bullish Turned
 Shareholding Snapshot : May 2026
Shareholding Compare (%holding)
Promoters
None
Held by 0 Schemes
Held by 8 FIIs (15.7%)
Gopal Gupta (59.23%)
Multitude Growth Funds Limited (5.78%)
10.69%
Quarterly Results Snapshot (Standalone) - Mar'26 - QoQ

QoQ Growth in quarter ended Mar 2026 is -72.58% vs 501.05% in Dec 2025
QoQ Growth in quarter ended Mar 2026 is -32.00% vs 1,594.95% in Dec 2025
Half Yearly Results Snapshot (Consolidated) - Sep'25
Growth in half year ended Sep 2025 is -47.47% vs 11.48% in Mar 2025

Growth in half year ended Sep 2025 is -61.32% vs -82.60% in Mar 2025
Nine Monthly Results Snapshot (Consolidated) - Dec'25
YoY Growth in nine months ended Dec 2025 is -10.51% vs 28.02% in Mar 2026
YoY Growth in nine months ended Dec 2025 is -46.99% vs 47.48% in Mar 2026
Annual Results Snapshot (Consolidated) - Mar'26
YoY Growth in year ended Mar 2026 is 63.70% vs 101.78% in Mar 2025
YoY Growth in year ended Mar 2026 is 52.22% vs 81.09% in Mar 2025
About Kesar India Ltd

Company Coordinates


