
Compare DDev Plastiks with Similar Stocks
Stock DNA
Specialty Chemicals
INR 2,675 Cr (Small Cap)
14.00
43
0.89%
0.00
19.92%
2.59
Total Returns (Price + Dividend) 
Latest dividend: 0.49946666666666667 per share ex-dividend date: Feb-20-2026
Risk Adjusted Returns v/s
Returns Beta

News

DDev Plastiks Industries Ltd is Rated Sell
DDev Plastiks Industries Ltd is rated Sell by MarketsMOJO, with this rating last updated on 16 Feb 2026. However, the analysis and financial metrics discussed here reflect the stock’s current position as of 20 June 2026, providing investors with an up-to-date view of the company’s fundamentals, returns, and technical outlook.
Read full news article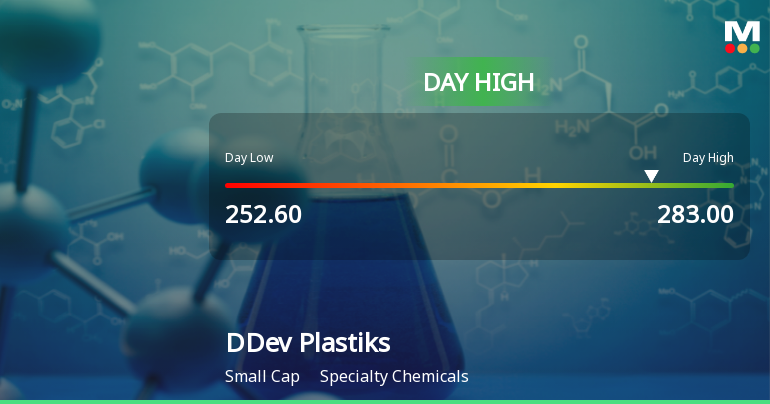
DDev Plastiks Industries Ltd Surges 9.56% to Day's High of Rs 273.55 — Outperforms Sector by 6.64 Percentage Points
While the Sensex declined by 0.95% on 19 Jun 2026, DDev Plastiks Industries Ltd surged 9.56%, touching an intraday high of Rs 273.55. This 6.64-percentage-point outperformance over its Specialty Chemicals sector underscores a distinctly stock-specific rally in an otherwise weak market environment.
Read full news article
DDev Plastiks Industries Ltd is Rated Sell
DDev Plastiks Industries Ltd is rated 'Sell' by MarketsMOJO, with this rating last updated on 16 February 2026. However, the analysis and financial metrics discussed here reflect the stock's current position as of 09 June 2026, providing investors with the latest insights into the company’s performance and outlook.
Read full news article Announcements
Announcement under Regulation 30 (LODR)-Analyst / Investor Meet - Intimation
08-Jun-2026 | Source : BSEPlease find attached the Intimation of Schedule of Analyst(s)/ Investor(s) meet to be held on 17.06.2026 at 11:00am (IST)
Announcement under Regulation 30 (LODR)-Earnings Call Transcript
28-May-2026 | Source : BSEPlease find attached the Transcripts of Earnings Call held on 26th May 2026 at 10:00am for the 04th quarter and financial year ended 31st March 2026.
Announcement under Regulation 30 (LODR)-Newspaper Publication
26-May-2026 | Source : BSEPlease find attached the Newspaper Publication of the Extract of Audited Financial Results for the 04th quarter and financial year ended 31.03.2026
Corporate Actions

No Upcoming Board Meetings

DDev Plastiks Industries Ltd has declared 50% dividend, ex-date: 20 Feb 26

No Splits history available

DDev Plastiks Industries Ltd has announced 1:10 bonus issue, ex-date: 30 Jun 23

No Rights history available
Quality key factors
Valuation key factors
Technicals key factors
 Technical Indicator Scale: Bearish, Mildly Bearish, Sideways, Mildly Bullish, Bullish Turned
 Shareholding Snapshot : Mar 2026
Shareholding Compare (%holding)
Promoters
None
Held by 0 Schemes
Held by 17 FIIs (0.9%)
Bbigplas Poly Private Limited (74.99%)
Jijjivish Investec Private Limited (4.4%)
13.57%
Quarterly Results Snapshot (Standalone) - Mar'26 - QoQ

QoQ Growth in quarter ended Mar 2026 is 4.48% vs 7.75% in Dec 2025

QoQ Growth in quarter ended Mar 2026 is 13.49% vs 1.97% in Dec 2025
Half Yearly Results Snapshot (Standalone) - Sep'25
Growth in half year ended Sep 2025 is 20.20% vs -5.83% in Sep 2024
Growth in half year ended Sep 2025 is 13.87% vs 8.85% in Sep 2024
Nine Monthly Results Snapshot (Standalone) - Dec'25
YoY Growth in nine months ended Dec 2025 is 16.91% vs 1.78% in Dec 2024
YoY Growth in nine months ended Dec 2025 is 10.11% vs 11.34% in Dec 2024
Annual Results Snapshot (Standalone) - Mar'26
YoY Growth in year ended Mar 2026 is 13.24% vs 7.08% in Mar 2025
YoY Growth in year ended Mar 2026 is 8.80% vs 2.11% in Mar 2025
About DDev Plastiks Industries Ltd

Company Coordinates


