
Compare Neogen Chemicals with Similar Stocks
Dashboard
Low ability to service debt as the company has a high Debt to EBITDA ratio of 10.16 times
- Poor long term growth as Operating profit has grown by an annual rate 13.82% of over the last 5 years
- Low ability to service debt as the company has a high Debt to EBITDA ratio of 10.16 times
- The company has been able to generate a Return on Equity (avg) of 6.86% signifying low profitability per unit of shareholders funds
Poor long term growth as Operating profit has grown by an annual rate 13.82% of over the last 5 years
The company has declared Negative results for the last 4 consecutive quarters
With ROCE of 5, it has a Very Expensive valuation with a 3.4 Enterprise value to Capital Employed
Stock DNA
Specialty Chemicals
INR 6,353 Cr (Small Cap)
217.00
46
0.04%
1.70
3.52%
7.62
Total Returns (Price + Dividend) 
Latest dividend: 0.999211356466877 per share ex-dividend date: Sep-19-2025
Risk Adjusted Returns v/s
Returns Beta

News
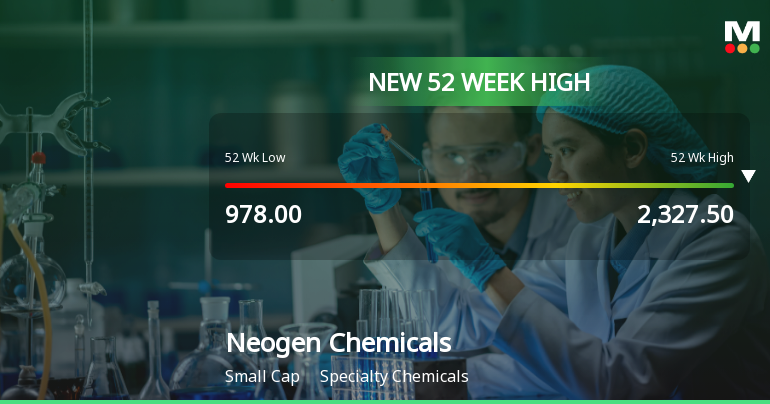
Broad-Based Technical Strength Lifts Neogen Chemicals Ltd to 52-Week High of Rs 2350
Surging past the Rs 2300 mark, Neogen Chemicals Ltd has reached a fresh 52-week high of Rs 2350 on 16 Jul 2026, propelled by a sustained six-day rally that has delivered over 20% returns in that span. This milestone caps a remarkable 45.7% gain over the past year, significantly outperforming the Sensex’s decline of 6.39% during the same period.
Read full news article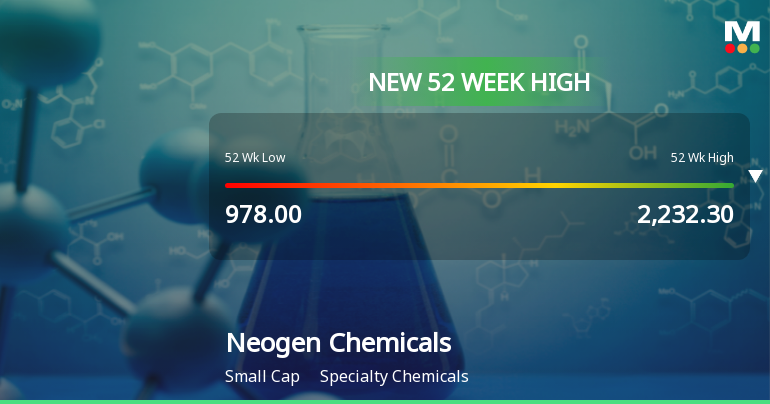
Broad-Based Technical Strength Lifts Neogen Chemicals Ltd to 52-Week High of Rs 2264
Surging past Rs 2264 on 15 Jul 2026, Neogen Chemicals Ltd has reached a fresh 52-week high, propelled by a confluence of bullish technical indicators and sustained price momentum that outpaces its sector and the broader market.
Read full news article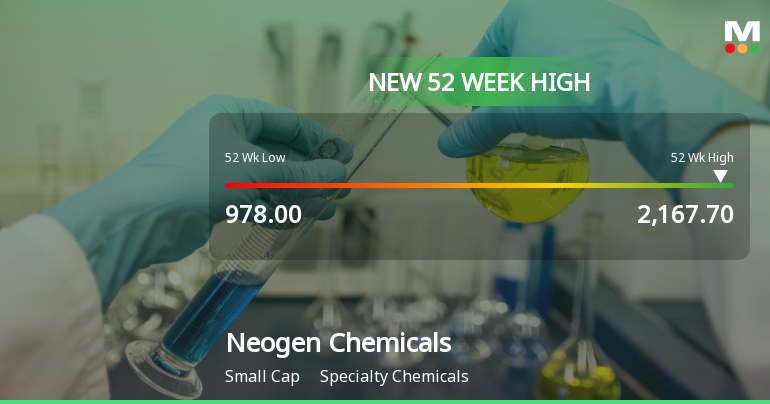
Broad-Based Technical Strength Lifts Neogen Chemicals Ltd to 52-Week High of Rs 2167.7
With a 52-week high of Rs 2167.7 reached on 14 Jul 2026, Neogen Chemicals Ltd has demonstrated robust price momentum, outperforming its sector and the broader market despite a modest pullback on the day. This milestone caps a 33.63% gain over the past year, contrasting sharply with the Sensex’s 6.25% decline over the same period.
Read full news article Announcements
Corporate Actions

No Upcoming Board Meetings

Neogen Chemicals Ltd has declared 10% dividend, ex-date: 19 Sep 25

No Splits history available

No Bonus history available

No Rights history available
Quality key factors
Valuation key factors
Technicals key factors
 Technical Indicator Scale: Bearish, Mildly Bearish, Sideways, Mildly Bullish, Bullish Turned
 Shareholding Snapshot : Apr 2026
Shareholding Compare (%holding)
Promoters
22.999
Held by 12 Schemes (18.29%)
Held by 37 FIIs (4.29%)
Haridas Kanani Family Trust (beena Haridas Kanani And Harin Haridas Kanani) (20.0%)
Sbi Contra Fund (8.85%)
14.67%
Quarterly Results Snapshot (Consolidated) - Mar'26 - QoQ

QoQ Growth in quarter ended Mar 2026 is 12.06% vs 5.44% in Dec 2025
QoQ Growth in quarter ended Mar 2026 is 208.67% vs 9.50% in Dec 2025
Half Yearly Results Snapshot (Consolidated) - Sep'25

Growth in half year ended Sep 2025 is 5.91% vs 14.31% in Sep 2024
Growth in half year ended Sep 2025 is -39.18% vs 26.83% in Sep 2024
Nine Monthly Results Snapshot (Consolidated) - Dec'25
YoY Growth in nine months ended Dec 2025 is 7.08% vs 17.05% in Dec 2024
YoY Growth in nine months ended Dec 2025 is -46.58% vs 73.09% in Dec 2024
Annual Results Snapshot (Consolidated) - Mar'26
YoY Growth in year ended Mar 2026 is 10.85% vs 12.58% in Mar 2025
YoY Growth in year ended Mar 2026 is -17.46% vs -2.30% in Mar 2025
About Neogen Chemicals Ltd

Company Coordinates


