
Compare Vishnu Chemicals with Similar Stocks
Stock DNA
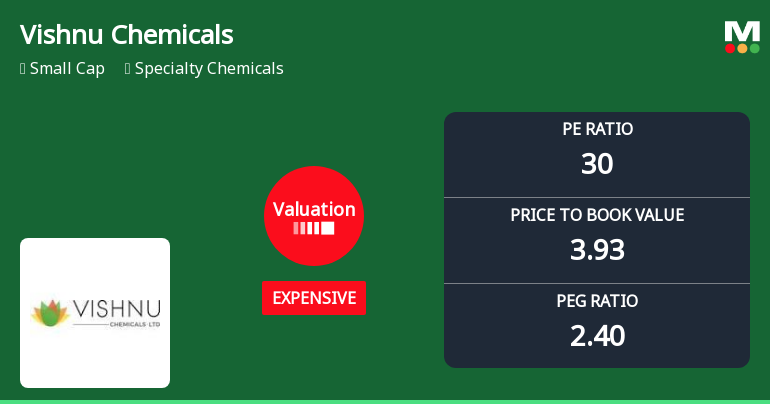
Specialty Chemicals
INR 4,174 Cr (Small Cap)
30.00
13
0.05%
0.40
13.31%
3.93
Total Returns (Price + Dividend) 
Latest dividend: 0.3023829697098072 per share ex-dividend date: Aug-08-2025
Risk Adjusted Returns v/s
Returns Beta

News
Vishnu Chemicals Ltd Valuation Shifts Signal Changing Market Sentiment
Vishnu Chemicals Ltd has witnessed a notable shift in its valuation parameters, moving from a fair to an expensive rating, reflecting evolving investor sentiment amid robust price performance and improving fundamentals. This article analyses the recent changes in key valuation metrics, compares them with industry peers, and assesses the implications for investors navigating the specialty chemicals sector.
Read full news article
Vishnu Chemicals Ltd Upgraded to Buy on Strong Technical and Financial Performance
Vishnu Chemicals Ltd, a specialty chemicals company, has seen its investment rating upgraded from Hold to Buy by MarketsMOJO as of 13 July 2026. This upgrade reflects a marked improvement across key parameters including technical indicators, valuation metrics, financial trends, and overall quality scores. The company’s robust quarterly results, favourable long-term growth prospects, and bullish technical signals have collectively driven this positive reassessment.
Read full news article
Vishnu Chemicals Ltd Technical Momentum Shifts Signal Bullish Outlook
Vishnu Chemicals Ltd has demonstrated a notable shift in its technical momentum, upgrading from a mildly bullish to a bullish stance, supported by robust signals across key indicators such as MACD, moving averages, and Bollinger Bands. This technical evolution, coupled with strong long-term returns relative to the Sensex, positions the specialty chemicals small-cap as an attractive buy opportunity for investors seeking growth in the sector.
Read full news article Announcements
Vishnu Chemicals Limited - Updates
30-Oct-2019 | Source : NSEVishnu Chemicals Limited has informed the Exchange regarding 'Certificate under Reg. 74(5) of SEBI (Depository Participants) Regulations, 2018 for the quarter ended 30th September, 2019'.
Price movement
17-Sep-2019 | Source : NSE
| Significant movement in price has been observed in Vishnu Chemicals Limited. The Exchange, in order to ensure that investors have latest relevant information about the company and to inform the market place so that the interest of the investors is safeguarded, had written to the company. Vishnu Chemicals Limited has submitted their response. |
Price movement
16-Sep-2019 | Source : NSE
| Significant movement in price has been observed in Vishnu Chemicals Limited. The Exchange, in order to ensure that investors have latest relevant information about the company and to inform the market place so that the interest of the investors is safeguarded, has written to the company. The response from the company is awaited. |
Corporate Actions

No Upcoming Board Meetings

Vishnu Chemicals Ltd has declared 15% dividend, ex-date: 08 Aug 25

Vishnu Chemicals Ltd has announced 2:10 stock split, ex-date: 13 Jan 23

No Bonus history available

No Rights history available
Quality key factors
Valuation key factors
Technicals key factors
 Technical Indicator Scale: Bearish, Mildly Bearish, Sideways, Mildly Bullish, Bullish Turned
 Shareholding Snapshot : Jun 2026
Shareholding Compare (%holding)
Promoters
None
Held by 4 Schemes (4.75%)
Held by 44 FIIs (2.51%)
Krishna Murthy Cherukuri Cherukuri (48.66%)
Franklin India Small Cap Fund (2.47%)
17.16%
Quarterly Results Snapshot (Consolidated) - Mar'26 - QoQ

QoQ Growth in quarter ended Mar 2026 is 9.48% vs 2.54% in Dec 2025
QoQ Growth in quarter ended Mar 2026 is 28.55% vs 2.68% in Dec 2025
Half Yearly Results Snapshot (Consolidated) - Sep'25

Growth in half year ended Sep 2025 is 9.57% vs 12.16% in Sep 2024
Growth in half year ended Sep 2025 is 22.13% vs 1.33% in Sep 2024
Nine Monthly Results Snapshot (Consolidated) - Dec'25
YoY Growth in nine months ended Dec 2025 is 10.01% vs 15.53% in Dec 2024
YoY Growth in nine months ended Dec 2025 is 12.72% vs 19.54% in Dec 2024
Annual Results Snapshot (Consolidated) - Mar'26
YoY Growth in year ended Mar 2026 is 11.28% vs 19.29% in Mar 2025
YoY Growth in year ended Mar 2026 is 12.34% vs 25.26% in Mar 2025
About Vishnu Chemicals Ltd

Company Coordinates


