
Compare Balaji Amines with Similar Stocks
Dashboard
Company has a Debt to Equity ratio (avg) of 0.01 times
Poor long term growth as Operating profit has grown by an annual rate -9.21% of over the last 5 years
The company has declared positive results in Mar'2026 after 7 consecutive negative quarters
With ROE of 8.5, it has a Very Expensive valuation with a 3.8 Price to Book Value
Despite the size of the company, domestic mutual funds hold only 0.26% of the company
Market Beating Performance
Stock DNA
Specialty Chemicals
INR 7,711 Cr (Small Cap)
45.00
46
0.95%
-0.07
8.46%
3.80
Total Returns (Price + Dividend) 
Latest dividend: 11 per share ex-dividend date: Jul-03-2026
Risk Adjusted Returns v/s
Returns Beta

News
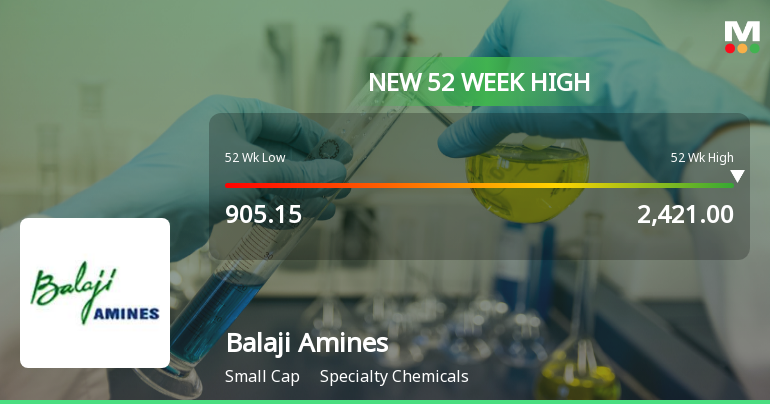
Broad-Based Technical Strength Lifts Balaji Amines Ltd to 52-Week High of Rs 2443.15
Surging to a fresh 52-week high of Rs 2443.15 on 13 Jul 2026, Balaji Amines Ltd has demonstrated remarkable price momentum, outperforming its sector and the broader market over the past year. This milestone caps a four-day winning streak that has propelled the stock up by 17.45%, underscoring the strength of its technical setup amid a mixed market backdrop.
Read full news article
Balaji Amines Ltd is Rated Hold
Balaji Amines Ltd is rated 'Hold' by MarketsMOJO, with this rating last updated on 13 May 2026. However, the analysis and financial metrics discussed here reflect the company’s current position as of 11 July 2026, providing investors with the latest insights into its performance and outlook.
Read full news article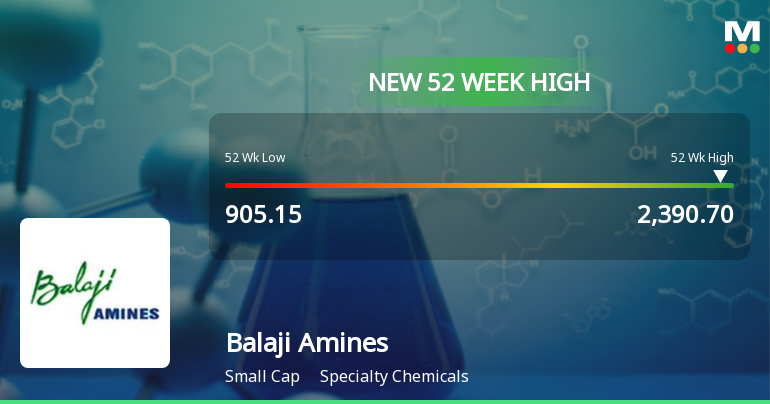
Broad-Based Technical Strength Lifts Balaji Amines Ltd to 52-Week High of Rs 2390.7
Surging to a new 52-week high of Rs 2390.7 on 10 Jul 2026, Balaji Amines Ltd has demonstrated robust price momentum, outpacing the broader market with a 25.47% gain over the past year compared to the Sensex’s decline of 6.81%. This milestone caps a sustained rally that has seen the stock climb from a low of Rs 905.15, reflecting strong technical underpinnings across multiple timeframes.
Read full news article Announcements
Balaji Amines Limited - Updates
28-Nov-2019 | Source : NSEBalaji Amines Limited has informed the Exchange regarding 'Environmental Clearance from the Ministry of Environment, Forests & Climate Change, Government of India.'.
Balaji Amines Limited - Registrar & Share Transfer Agent Update
04-Nov-2019 | Source : NSEBalaji Amines Limited has informed the Exchange regarding the Registrar & Share Transfer Agent Update
Balaji Amines Limited - Updates
31-Oct-2019 | Source : NSEBalaji Amines Limited has informed the Exchange regarding 'copy of newspaper advertisement of the unaudited Financial Results of the Company for the second quarter and half year ended 30th September, 2019 '.
Corporate Actions

No Upcoming Board Meetings

Balaji Amines Ltd has declared 550% dividend, ex-date: 03 Jul 26

Balaji Amines Ltd has announced 2:10 stock split, ex-date: 18 Nov 10

Balaji Amines Ltd has announced 1:1 bonus issue, ex-date: 05 Mar 07

No Rights history available
Quality key factors
Valuation key factors
Technicals key factors
 Technical Indicator Scale: Bearish, Mildly Bearish, Sideways, Mildly Bullish, Bullish Turned
 Shareholding Snapshot : Mar 2026
Shareholding Compare (%holding)
Promoters
17.6687
Held by 6 Schemes (0.12%)
Held by 56 FIIs (2.98%)
Ande Prathap Reddy (15.34%)
Vijaya Nalla (2.13%)
35.73%
Quarterly Results Snapshot (Consolidated) - Mar'26 - QoQ

QoQ Growth in quarter ended Mar 2026 is 19.16% vs -2.72% in Dec 2025
QoQ Growth in quarter ended Mar 2026 is 101.11% vs -9.06% in Dec 2025
Half Yearly Results Snapshot (Consolidated) - Sep'25
Growth in half year ended Sep 2025 is -4.47% vs -13.34% in Sep 2024

Growth in half year ended Sep 2025 is -13.90% vs -3.64% in Sep 2024
Nine Monthly Results Snapshot (Consolidated) - Dec'25
YoY Growth in nine months ended Dec 2025 is -1.36% vs -14.93% in Dec 2024
YoY Growth in nine months ended Dec 2025 is -11.47% vs -14.15% in Dec 2024
Annual Results Snapshot (Consolidated) - Mar'26
YoY Growth in year ended Mar 2026 is 2.00% vs -14.89% in Mar 2025
YoY Growth in year ended Mar 2026 is 6.15% vs -23.10% in Mar 2025
About Balaji Amines Ltd

Company Coordinates


