
Compare Foseco India with Similar Stocks
Stock DNA
Specialty Chemicals
INR 3,930 Cr (Small Cap)
41.00
43
0.48%
-0.29
8.09%
3.76
Total Returns (Price + Dividend) 
Latest dividend: 25.061922018860837 per share ex-dividend date: Jun-03-2026
Risk Adjusted Returns v/s
Returns Beta

News

Foseco India Ltd. is Rated Sell
Foseco India Ltd. is rated Sell by MarketsMOJO, with this rating last updated on 18 May 2026. However, the analysis and financial metrics discussed here reflect the stock’s current position as of 21 June 2026, providing investors with the latest insights into the company’s fundamentals, valuation, financial trends, and technical outlook.
Read full news article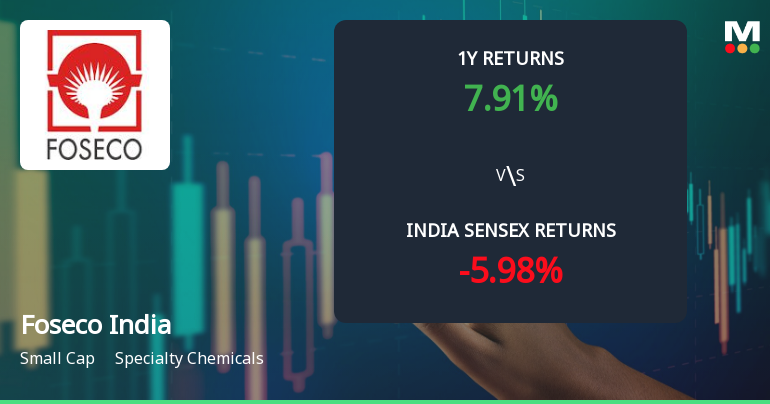
Foseco India Ltd. Technical Momentum Shifts Amid Mixed Indicator Signals
Foseco India Ltd., a small-cap player in the Specialty Chemicals sector, has experienced a notable shift in its technical momentum, moving from a mildly bearish stance to a sideways trend. Despite a 2.65% gain on 16 Jun 2026, the stock’s technical indicators present a complex picture, with mixed signals from MACD, RSI, moving averages, and other momentum oscillators, prompting a recent downgrade in its Mojo Grade from Hold to Sell.
Read full news article
Announcements
Foseco India Limited - Dividend Updates
01-Nov-2019 | Source : NSEFoseco India Limited has informed the Exchange that The Board of Directors at its Meeting held on October 31, 2019 has declared an interim dividend of Rs. 7/- (70%) per equity share of Rs. 10/- each, for the financial year ending on December 31, 2019.
Resignation
20-Sep-2019 | Source : NSE
| Foseco India Limited has informed the Exchange regarding Resignation of Mr Glenn Allan Cowie as Non- Executive Director of the company w.e.f. September 20, 2019. |
Related Party Transactions
23-Aug-2019 | Source : NSE
| Foseco India Limited has informed the Exchange regarding Disclosure of Related Party Transactions for the half-year ended June 30, 2019, |
Corporate Actions

No Upcoming Board Meetings

Foseco India Ltd. has declared 250% dividend, ex-date: 03 Jun 26

No Splits history available

No Bonus history available

No Rights history available
Quality key factors
Valuation key factors
Technicals key factors
 Technical Indicator Scale: Bearish, Mildly Bearish, Sideways, Mildly Bullish, Bullish Turned
 Shareholding Snapshot : Mar 2026
Shareholding Compare (%holding)
Promoters
None
Held by 2 Schemes (0.57%)
Held by 9 FIIs (0.08%)
Foseco Overseas Limited (49.15%)
Karibu Limited (9.73%)
9.29%
Quarterly Results Snapshot (Standalone) - Mar'26 - QoQ

QoQ Growth in quarter ended Mar 2026 is 10.28% vs -2.12% in Dec 2025
QoQ Growth in quarter ended Mar 2026 is 54.28% vs -5.82% in Dec 2025
Half Yearly Results Snapshot (Standalone) - Jun'25
Growth in half year ended Jun 2025 is 23.51% vs 6.76% in Jun 2024
Growth in half year ended Jun 2025 is 25.76% vs -18.02% in Jun 2024
Nine Monthly Results Snapshot (Standalone) - Sep'25
YoY Growth in nine months ended Sep 2025 is 17.56% vs 9.36% in Sep 2024
YoY Growth in nine months ended Sep 2025 is 11.61% vs -5.63% in Sep 2024
Annual Results Snapshot (Standalone) - Dec'25
YoY Growth in year ended Dec 2025 is 15.10% vs 9.92% in Dec 2024
YoY Growth in year ended Dec 2025 is 3.00% vs 0.07% in Dec 2024
About Foseco India Ltd.

Company Coordinates


