
Compare Global Health with Similar Stocks
Dashboard
High Management Efficiency with a high ROE of 15.69%
The company is Net-Debt Free
Poor long term growth as Operating profit has grown by an annual rate 15.40% of over the last 5 years
Negative results in Mar 26
With ROE of 15.8, it has a Expensive valuation with a 9.5 Price to Book Value
High Institutional Holdings at 24.91%
Market Beating performance in long term as well as near term
Total Returns (Price + Dividend) 
Latest dividend: 0.5 per share ex-dividend date: Aug-22-2025
Risk Adjusted Returns v/s
Returns Beta

News

Global Health Ltd is Rated Hold by MarketsMOJO
Global Health Ltd is rated 'Hold' by MarketsMOJO, with this rating last updated on 08 Jun 2026. However, the analysis and financial metrics presented here reflect the company’s current position as of 19 June 2026, providing investors with the latest insights into its performance and outlook.
Read full news article
Global Health Ltd is Rated Sell
Global Health Ltd is rated 'Sell' by MarketsMOJO, with this rating last updated on 01 June 2026. However, the analysis and financial metrics discussed here reflect the company’s current position as of 08 June 2026, providing investors with an up-to-date view of the stock’s fundamentals, valuation, financial trends, and technical outlook.
Read full news article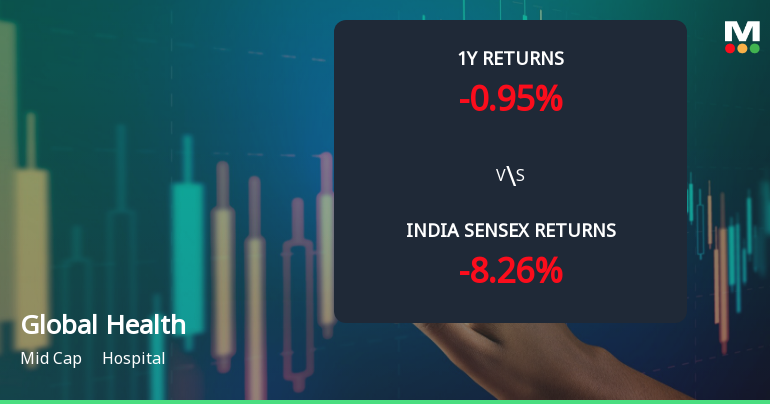
Global Health Ltd Technical Momentum Shifts Amid Mixed Indicator Signals
Global Health Ltd has exhibited a notable shift in its technical momentum, moving from a sideways trend to a mildly bullish stance, supported by a blend of bullish and bearish signals across key technical indicators. Despite a recent upgrade in price momentum, the company’s overall MarketsMOJO grade has been downgraded to Sell, reflecting a cautious outlook amid mixed market signals and sector dynamics.
Read full news article Announcements
Announcement under Regulation 30 (LODR)-Analyst / Investor Meet - Intimation
18-Jun-2026 | Source : BSEAnnouncement under SEBI Listing Regulations regarding schedule of Analyst meet.
Announcement under Regulation 30 (LODR)-Analyst / Investor Meet - Intimation
18-Jun-2026 | Source : BSEAnnouncement under SEBI Listing Regulations regarding schedule of Analyst meet.
Announcement under Regulation 30 (LODR)-Analyst / Investor Meet - Intimation
18-Jun-2026 | Source : BSEAnnouncement under SEBI Listing Regulations regarding schedule of Analyst meet.
Corporate Actions

No Upcoming Board Meetings

Global Health Ltd has declared 25% dividend, ex-date: 22 Aug 25

No Splits history available

No Bonus history available

No Rights history available
Quality key factors
Valuation key factors
Technicals key factors
 Technical Indicator Scale: Bearish, Mildly Bearish, Sideways, Mildly Bullish, Bullish Turned
 Shareholding Snapshot : Mar 2026
Shareholding Compare (%holding)
Non Institution
None
Held by 27 Schemes (13.91%)
Held by 154 FIIs (10.15%)
Naresh Trehan (33.01%)
Dunearn Investments (mauritius) Pte Ltd (14.84%)
5.88%
Quarterly Results Snapshot (Consolidated) - Mar'26 - QoQ

QoQ Growth in quarter ended Mar 2026 is 3.39% vs 1.99% in Dec 2025
QoQ Growth in quarter ended Mar 2026 is 51.54% vs -40.03% in Dec 2025
Half Yearly Results Snapshot (Consolidated) - Sep'25
Growth in half year ended Sep 2025 is 17.19% vs 12.41% in Sep 2024
Growth in half year ended Sep 2025 is 33.87% vs 4.38% in Sep 2024
Nine Monthly Results Snapshot (Consolidated) - Dec'25
YoY Growth in nine months ended Dec 2025 is 17.75% vs 12.54% in Dec 2024
YoY Growth in nine months ended Dec 2025 is 8.53% vs 8.33% in Dec 2024
Annual Results Snapshot (Consolidated) - Mar'26
YoY Growth in year ended Mar 2026 is 19.44% vs 12.74% in Mar 2025
YoY Growth in year ended Mar 2026 is 15.58% vs 0.68% in Mar 2025
About Global Health Ltd

Company Coordinates


