
Compare Aster DM Health. with Similar Stocks
Dashboard
High Management Efficiency with a high ROE of 18.40%
Poor long term growth as Net Sales has grown by an annual rate of -11.76% over the last 5 years
Flat results in Mar 26
With ROCE of 11.6, it has a Very Expensive valuation with a 7.9 Enterprise value to Capital Employed
40.66% of Promoter Shares are Pledged
Market Beating performance in long term as well as near term
Stock DNA
Hospital
INR 42,305 Cr (Small Cap)
104.00
60
0.49%
0.20
8.90%
9.20
Total Returns (Price + Dividend) 
Latest dividend: 3 per share ex-dividend date: Apr-02-2026
Risk Adjusted Returns v/s
Returns Beta

News
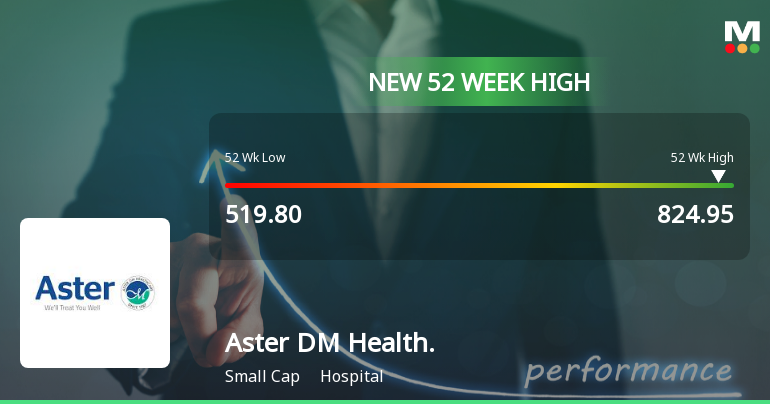
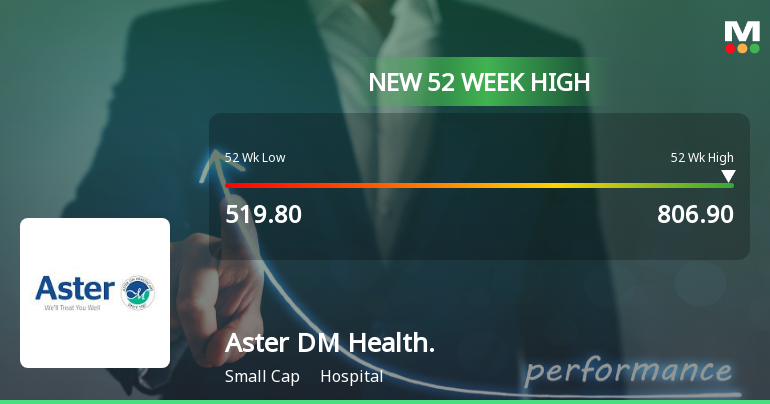
Broad-Based Technical Strength Lifts Aster DM Healthcare Ltd to 52-Week High of Rs 825
Surging past its previous peak, Aster DM Healthcare Ltd reached a fresh 52-week high of Rs 825 on 11 Jun 2026, marking a significant milestone in its price journey. This rally has been fuelled by a confluence of robust technical indicators and sustained price momentum, setting the stock apart in a market environment where the broader indices have struggled.
Read full news article
Announcements
Aster DM Healthcare Limited - Analysts/Institutional Investor Meet/Con. Call Updates
09-Dec-2019 | Source : NSEAster DM Healthcare Limited has informed the Exchange regarding Analysts/Institutional Investor Meet/Con. Call Updates
Aster DM Healthcare Limited - Other General Purpose
03-Dec-2019 | Source : NSEAster DM Healthcare Limited has informed the Exchange regarding Disclosure under Regulation 23 (9) of SEBI (Listing Obligations and Disclosure Requirements) Regulations, 2015.
Aster DM Healthcare Limited - Monitoring Agency Report
13-Nov-2019 | Source : NSEAster DM Healthcare Limited has informed the Exchange regarding Report of Monitoring Agency pursuant to Regulation 32 (6) of the SEBI (Listing Obligations and Disclosure Requirements) Regulations, 2015 for quarter ended September 30, 2019.
Corporate Actions

No Upcoming Board Meetings

Aster DM Healthcare Ltd has declared 30% dividend, ex-date: 02 Apr 26

No Splits history available

No Bonus history available

No Rights history available
Quality key factors
Valuation key factors
Technicals key factors
 Technical Indicator Scale: Bearish, Mildly Bearish, Sideways, Mildly Bullish, Bullish Turned
 Shareholding Snapshot : Mar 2026
Shareholding Compare (%holding)
Promoters
40.6609
Held by 30 Schemes (26.45%)
Held by 156 FIIs (17.18%)
Union Investments Private Limited (36.06%)
Hdfc Small Cap Fund (7.75%)
3.93%
Quarterly Results Snapshot (Consolidated) - Mar'26 - YoY

YoY Growth in quarter ended Mar 2026 is 18.20% vs 2.75% in Mar 2025

YoY Growth in quarter ended Mar 2026 is 77.39% vs 428.84% in Mar 2025
Half Yearly Results Snapshot (Consolidated) - Sep'25
Growth in half year ended Sep 2025 is 8.94% vs 17.94% in Sep 2024
Growth in half year ended Sep 2025 is -96.27% vs 20,347.28% in Sep 2024
Nine Monthly Results Snapshot (Consolidated) - Dec'25
YoY Growth in nine months ended Dec 2025 is 10.28% vs -42.75% in Dec 2024
YoY Growth in nine months ended Dec 2025 is -95.32% vs 3,356.05% in Dec 2024
Annual Results Snapshot (Consolidated) - Mar'26
YoY Growth in year ended Mar 2026 is 12.20% vs 11.88% in Mar 2025
YoY Growth in year ended Mar 2026 is -92.78% vs 4,059.83% in Mar 2025
About Aster DM Healthcare Ltd

Company Coordinates


