
Compare Aarti Pharma with Similar Stocks
Dashboard
Poor long term growth as Net Sales has grown by an annual rate of -2.20% over the last 5 years
The company has declared Negative results for the last 4 consecutive quarters
Despite the size of the company, domestic mutual funds hold only 1.41% of the company
Underperformed the market in the last 1 year
Stock DNA
Pharmaceuticals & Biotechnology
INR 6,564 Cr (Small Cap)
34.00
34
0.59%
0.35
8.88%
2.90
Total Returns (Price + Dividend) 
Latest dividend: 1.4966362999299228 per share ex-dividend date: Feb-16-2026
Risk Adjusted Returns v/s
Returns Beta

News
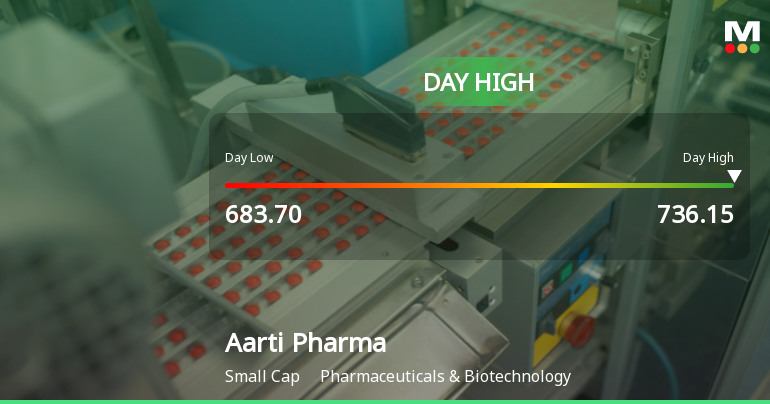
Aarti Pharmalabs Ltd Surges 7.53% to Day's High of Rs 735 — Outperforms Sector by 6.13 Percentage Points
The Sensex edged up 0.10% on 23 Jun 2026, while Aarti Pharmalabs Ltd surged 7.53% to touch an intraday high of Rs 735, outperforming its Pharmaceuticals & Biotechnology sector by 6.13 percentage points. This sharp single-session gain stands out as a significant stock-specific event amid a broadly positive but modest market advance.
Read full news article
Aarti Pharmalabs Ltd Technical Momentum Shifts Amid Mixed Market Signals
Aarti Pharmalabs Ltd has experienced a nuanced shift in its technical momentum, moving from a strongly bearish stance to a mildly bearish outlook as of mid-June 2026. Despite a recent downgrade in its Mojo Grade from Strong Sell to Sell, the stock’s technical indicators present a complex picture, reflecting both caution and pockets of bullishness amid broader market pressures.
Read full news article
Aarti Pharmalabs Ltd Technical Momentum Shifts Amid Mixed Market Signals
Aarti Pharmalabs Ltd has experienced a notable shift in its technical momentum, moving from a mildly bearish stance to a more pronounced bearish trend. Despite a 5.01% gain on 22 Jun 2026, the stock’s technical indicators present a complex picture, with mixed signals across weekly and monthly timeframes, reflecting cautious investor sentiment in the Pharmaceuticals & Biotechnology sector.
Read full news article Announcements
Announcement under Regulation 30 (LODR)-Earnings Call Transcript
01-Jun-2026 | Source : BSETranscript of Q4 FY 26 Earnings Conference Call.
Audited Financial Results For The Quarter And Financial Year Ended March 31 2026
26-May-2026 | Source : BSEThe Outcome was intimated within the prescribed timelines under various heads however the same was inadvertently missed under Results Tab therefore uploading the same.
Compliances-Reg.24(A)-Annual Secretarial Compliance
26-May-2026 | Source : BSEAnnual Secretarial Compliance Report for the Financial Year 2025-26
Corporate Actions

No Upcoming Board Meetings

Aarti Pharmalabs Ltd has declared 30% dividend, ex-date: 16 Feb 26

No Splits history available

No Bonus history available

No Rights history available
Quality key factors
Valuation key factors
Technicals key factors
 Technical Indicator Scale: Bearish, Mildly Bearish, Sideways, Mildly Bullish, Bullish Turned
 Shareholding Snapshot : Mar 2026
Shareholding Compare (%holding)
Promoters
11.0271
Held by 11 Schemes (0.8%)
Held by 108 FIIs (8.39%)
Rashesh Chandrakant Gogri (4.23%)
Life Insurance Corporation Of India (5.28%)
34.29%
Quarterly Results Snapshot (Consolidated) - Mar'26 - QoQ

QoQ Growth in quarter ended Mar 2026 is 34.79% vs 3.33% in Dec 2025

QoQ Growth in quarter ended Mar 2026 is 27.44% vs 71.78% in Dec 2025
Half Yearly Results Snapshot (Consolidated) - Sep'25
Growth in half year ended Sep 2025 is -20.62% vs 12.85% in Sep 2024
Growth in half year ended Sep 2025 is -29.64% vs 11.32% in Sep 2024
Nine Monthly Results Snapshot (Consolidated) - Dec'25
YoY Growth in nine months ended Dec 2025 is -20.27% vs 15.18% in Dec 2024
YoY Growth in nine months ended Dec 2025 is -31.87% vs 21.38% in Dec 2024
Annual Results Snapshot (Consolidated) - Mar'26
YoY Growth in year ended Mar 2026 is -13.98% vs 14.17% in Mar 2025
YoY Growth in year ended Mar 2026 is -35.86% vs 25.59% in Mar 2025
About Aarti Pharmalabs Ltd

Company Coordinates


