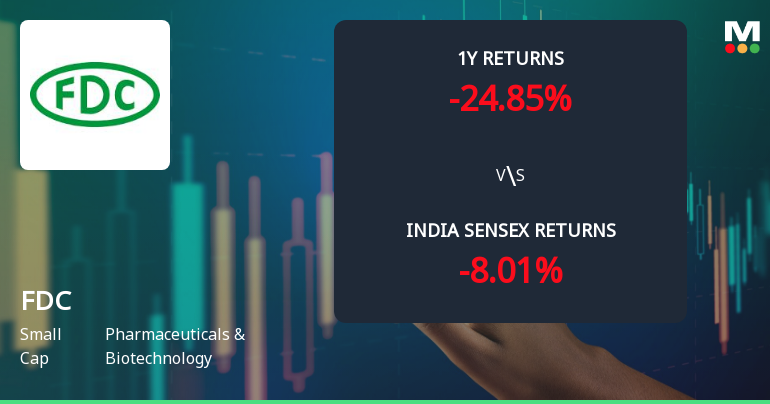
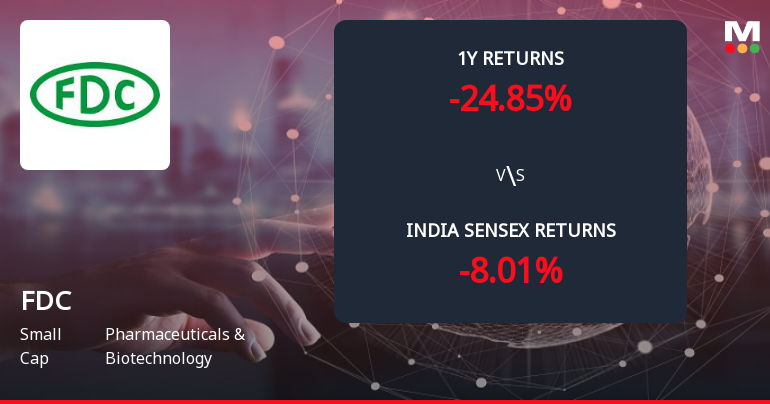
FDC

  • Market Cap: Small Cap
  • Industry: Pharmaceuticals & Biotechnology
  • ISIN: INE258B01022
  • NSEID: FDC
  • BSEID: 531599
INR
352.95
2 (0.57%)
BSENSE

Sep 18, 03:30 PM

BSE+NSE Vol: 1.18 lacs

  • Price Points
  • Score
  • Mojo Parameters
  • Total Return
  • News and Corporate Actions
  • Key factors
  • Shareholding
  • Financials
  • CompanyCV
stock-summaryPrice Point
High/Low

1Day

52 Week

Valuation
Technical
Day's Volume

CASH

1.18 lacs (-45.47%) Volume

Shareholding (Jun 2026)

FII

1.40%

Held by 74 FIIs

DII

6.31%

Held by 9 DIIs

Promoter

69.66%

Why is FDC Ltd falling/rising?

06-Sep-2026

As of 05-Sep, FDC Ltd's stock price is rising to 342.65, reflecting a short-term positive trend with a 2.13% return over three days. Recent strong financial results, including an 89.2% increase in profit before tax, have contributed to this rise, despite a long-term decline in performance and reduced institutional investor participation.

As of 05-Sep, FDC Ltd's stock price is rising, currently at 342.65, with a change of 1.05 (0.31%) upward. The stock has been gaining for the last three days, with a total return of 2.13% during this period, which indicates a positive short-term trend. Additionally, it has outperformed its sector by 0.71% today.<BR><BR>Despite a challenging longer-term performance, where the stock has seen a decline of 25.47% over the past year and a negative annual growth rate of operating profit by -2.21% over the last five years, recent positive financial results have contributed to the current rise. The company reported a significant increase in profit before tax, which grew by 89.2% compared to the previous four-quarter average, and achieved its highest net sales at Rs 667.69 crore. Furthermore, the company is net-debt free and is trading at a discount compared to its peers' average historical valuations, which may attract investors looking for value.<BR><BR>However, it is important to note that there has been a decrease in institutional investor participation, with a reduction of -0.98% in their stake over the previous quarter, which could indicate caution among more experienced investors. Despite this, the stock's recent performance, positive financial results, and fair valuation may be driving the current upward movement in its price.

View full answer

Who are in the management team of FDC?

01-Sep-2026

The management team of FDC includes key individuals such as Mohan A Chandavarkar (Managing Director), Ameya A Chandavarkar (Executive Director & CEO), and Uday Kumar Gurkar (Chairman & Independent Director), among others, who oversee the company's governance and strategic direction.

The management team of FDC includes the following key individuals:<BR><BR>1. **Mohan A Chandavarkar** - Managing Director<BR>2. **Ashok A Chandavarkar** - Director<BR>3. **Nandan M Chandavarkar** - Joint Managing Director<BR>4. **Ameya A Chandavarkar** - Executive Director & CEO<BR>5. **Ramdas A Chandavarkar** - Chairman Emeritus<BR>6. **Varsharani Katre** - Company Secretary & Compliance Officer<BR>7. **Nomita R Chandavarkar** - Director<BR>8. **Swati S Mayekar** - Independent Director<BR>9. **Uday Kumar Gurkar** - Chairman & Independent Director<BR>10. **Melarkode Ganesan Parameswaran** - Independent Director<BR>11. **Usha Athreya Chandrasekhar** - Independent Director<BR>12. **Mahesh Bijlani** - Independent Director<BR>13. **Vijay Maniar** - Additional Independent Director<BR><BR>This team plays a crucial role in the governance and strategic direction of the company.

View full answer

What does FDC do?

01-Sep-2026

FDC Ltd is a research-oriented pharmaceutical company in India, specializing in manufacturing and marketing formulations and active pharmaceutical ingredients. As of June 2026, it reported net sales of 668 Cr and a net profit of 132 Cr, with a market cap of INR 5,503 Cr.

Overview:<BR>FDC Ltd is a fully integrated, research-oriented pharmaceutical company engaged in the manufacturing and marketing of formulations and active pharmaceutical ingredients, operating within the Pharmaceuticals & Biotechnology industry and classified as a Small Cap.<BR><BR>History:<BR>FDC Ltd was incorporated in an unspecified year and has maintained its status as a prominent player in the Indian pharmaceutical industry. The latest quarterly results reported net sales and net profit for June 2026.<BR><BR>Financial Snapshot:<BR>- Net Sales: 668 Cr (Quarterly Results - Jun 2026)<BR>- Net Profit: 132 Cr (Quarterly Results - Jun 2026)<BR>- Market-cap: INR 5,503 Cr (Small Cap)<BR><BR>Key Metrics:<BR>- P/E: 18.00<BR>- Industry P/E: 37<BR>- Dividend Yield: 1.45%<BR>- Debt Equity: -0.20<BR>- Return on Equity: 11.98%<BR>- Price to Book: 2.26<BR><BR>Contact Details:<BR>- Address: B-8 MIDC Industrial Area, Waluj Dist Aurangabad (Maharashtra) Maharashtra : 431136<BR>- Tel: 91-240-2554407/967/299<BR>- Email: investors@fdcindia.com<BR>- Website: http://www.fdcindia.com

View full answer

Who are the peers of the FDC?

01-Sep-2026

FDC's peers include Bliss GVS Pharma, SPARC, Supriya Lifesci., Innova Captab, Orchid Pharma, Morepen Labs, IOL Chemicals, Guj. Themis Bio., RPG LifeScience, and Gufic BioScience. Bliss GVS Pharma leads in 1-year returns at 295.64%, while FDC has the lowest at -26.41%.

Peers: The peers of FDC are Bliss GVS Pharma, SPARC, Supriya Lifesci., Innova Captab, Orchid Pharma, Morepen Labs., IOL Chemicals, Guj. Themis Bio., RPG LifeScience, and Gufic BioScience.<BR><BR>Quality Snapshot: Excellent management risk is observed at Bliss GVS Pharma, Supriya Lifesci., Innova Captab, and Guj. Themis Bio., while Average management risk is found at SPARC, Orchid Pharma, Morepen Labs., IOL Chemicals, RPG LifeScience, and Gufic BioScience. Good growth is seen at SPARC and Guj. Themis Bio., while Average growth is noted at Innova Captab, and the rest have Below Average growth. Excellent capital structure is present at Bliss GVS Pharma, Supriya Lifesci., Innova Captab, Morepen Labs., IOL Chemicals, Guj. Themis Bio., and RPG LifeScience, while Average capital structure is found at SPARC and Orchid Pharma, and Below Average at Gufic BioScience.<BR><BR>Return Snapshot: The peer with the highest 1-year return is Bliss GVS Pharma at 295.64%, while FDC has the lowest at -26.41%. This indicates that FDC's 1-year return is significantly lower than that of its peers. Additionally, the peers with negative six-month returns include FDC and Orchid Pharma.

View full answer

How big is FDC?

01-Sep-2026

As of 31st August, FDC Ltd has a market capitalization of 5,503.00 Cr, with recent Net Sales of 2,190.22 Cr and a Net Profit of 292.56 Cr. Shareholder's Funds are 2,281.08 Cr and Total Assets amount to 2,713.80 Cr as of March 2025.

As of 31st August, FDC Ltd has a market capitalization of 5,503.00 Cr, categorizing it as a Small Cap company.<BR><BR>In the latest four quarters, FDC reported Net Sales of 2,190.22 Cr and a Net Profit of 292.56 Cr.<BR><BR>The latest annual period for the balance sheet is March 2025, with Shareholder's Funds amounting to 2,281.08 Cr and Total Assets of 2,713.80 Cr.

View full answer

Should I buy, sell or hold FDC Ltd?

18-Aug-2026

Are FDC Ltd latest results good or bad?

06-Aug-2026

FDC Ltd's latest Q1 FY27 results are strong, with a net profit of ₹132.49 crore, a 28.13% QoQ increase, and revenue of ₹667.69 crore, up 14.18% QoQ. However, investors should be cautious due to the company's historical volatility in margins and profitability.

FDC Ltd's latest results for Q1 FY27 can be considered good overall, showcasing strong performance in several key areas. The company reported a net profit of ₹132.49 crore, which represents a significant increase of 28.13% quarter-on-quarter (QoQ) and 9.17% year-on-year (YoY). Revenue also saw a healthy rise, reaching ₹667.69 crore, up 14.18% QoQ and 2.97% YoY, marking the highest quarterly revenue in recent history.<BR><BR>Moreover, the operating margin improved to 21.42%, up from 18.19% in the previous quarter, indicating better cost management and operational efficiency. The profit after tax (PAT) margin also increased to 19.84%, reflecting strong operational leverage.<BR><BR>However, while these quarterly results are impressive, it's important to note that FDC has faced historical volatility in its margins and profitability. The company has shown mixed signals over the longer term, with challenges in sustaining consistent profitability and competitive positioning. <BR><BR>In summary, the latest results are strong and indicate positive momentum, but investors should remain cautious about the company's ability to maintain this performance in the future.

View full answer

When is the next results date for FDC Ltd?

24-Jul-2026

The next results date for FDC Ltd is 05 August 2026.

The next results date for FDC Ltd is scheduled for 05 August 2026.

View full answer

Is FDC technically bullish or bearish?

19-Nov-2025

As of November 18, 2025, FDC's technical trend has shifted to a moderate bearish stance, driven by bearish MACD, moving averages, and Bollinger Bands, despite a conflicting bullish signal from the OBV on the monthly timeframe.

As of 18 November 2025, the technical trend has changed from mildly bearish to bearish. The current technical stance for FDC is bearish with a moderate strength. Key indicators driving this stance include a bearish MACD on the weekly timeframe, bearish moving averages on the daily timeframe, and a bearish signal from Bollinger Bands on both weekly and monthly timeframes. The KST is also bearish on the weekly, reinforcing the negative outlook. Although the OBV shows a bullish signal on the monthly, it does not outweigh the overall bearish indicators.

View full answer

How has been the historical performance of FDC?

06-Nov-2025

FDC has shown consistent growth in net sales, increasing from 1,090.70 Cr in Mar'19 to 2,108.12 Cr in Mar'25, while total assets rose to 2,713.80 Cr. However, profit margins and earnings per share have experienced volatility, with EPS declining from 18.75 in Mar'24 to 16.39 in Mar'25.

Answer:<BR>The historical performance of FDC shows a consistent growth trend in net sales and overall financial metrics over the years.<BR><BR>Breakdown:<BR>FDC's net sales have increased from 1,090.70 Cr in Mar'19 to 2,108.12 Cr in Mar'25, reflecting a steady growth trajectory. The total operating income has similarly risen, reaching 2,108.12 Cr in Mar'25 from 1,090.70 Cr in Mar'19. However, the total expenditure has also grown, amounting to 1,783.32 Cr in Mar'25, up from 859.68 Cr in Mar'19. Operating profit (PBDIT) has fluctuated, peaking at 440.17 Cr in Mar'24 before dropping to 415.46 Cr in Mar'25. Profit before tax reached 357.22 Cr in Mar'25, while profit after tax was recorded at 266.79 Cr. The earnings per share (EPS) decreased from 18.75 in Mar'24 to 16.39 in Mar'25, indicating a decline despite the growth in sales. On the balance sheet, total assets increased from 1,812.93 Cr in Mar'20 to 2,713.80 Cr in Mar'25, with total liabilities also rising to 2,713.80 Cr in Mar'25. Cash flow from operating activities improved significantly to 317.00 Cr in Mar'25 from 220.00 Cr in Mar'24, contributing to a net cash inflow of 26.00 Cr in Mar'25. Overall, FDC has demonstrated growth in sales and assets, although profit margins and EPS have shown some volatility.

View full answer

Who are the top shareholders of the FDC?

17-Jul-2025

The top shareholders of FDC include promoter Nomita R Chandavarkar with 22.67%, mutual funds at 6.18%, foreign institutional investors at 2.55%, and individual investors collectively owning 16.22%. The largest public shareholder is the ICICI Prudential Smallcap Fund, holding 2.87%.

The top shareholders of FDC include the promoters, who hold the majority of the shares. The promoter with the highest holding is Nomita R Chandavarkar, owning 22.67% of the company. In addition, mutual funds hold 6.18% of the shares through 10 different schemes, while foreign institutional investors (FIIs) hold 2.55% through 105 different entities. The highest public shareholder is the ICICI Prudential Smallcap Fund, which holds 2.87%. Individual investors collectively own 16.22% of the company.

View full answer

Is FDC overvalued or undervalued?

09-Jun-2025

As of March 5, 2025, FDC is considered overvalued with a valuation grade of expensive, reflected by a PE ratio of 26.12 and a year-to-date return of -12.40%, compared to the Sensex's 5.59%.

As of 5 March 2025, the valuation grade for FDC has moved from fair to expensive, indicating that the company is currently overvalued. The key ratios supporting this assessment include a PE ratio of 26.12, an EV to EBITDA of 20.33, and a Price to Book Value of 3.05. Compared to its peers, FDC's valuation appears high; for instance, Sun Pharma has a PE ratio of 35.25, while Cipla, considered attractive, has a PE of 22.99.<BR><BR>In light of these metrics, FDC is deemed overvalued relative to its industry peers. The company's recent stock performance has lagged behind the Sensex, with a year-to-date return of -12.40% compared to the Sensex's 5.59%, further reinforcing the notion that the stock may not be a favorable investment at its current price of 434.75.

View full answer

Has FDC declared dividend?

06-Jun-2025

FDC Ltd has declared a 500% dividend, amounting to ₹5 per share, with an ex-date of November 22, 2024. While recent returns have shown volatility, the company has demonstrated positive growth over the longer term, particularly in the 2 to 5-year periods.

FDC Ltd has declared a 500% dividend.<BR><BR>Dividend Details:<BR>- Percentage announced: 500%<BR>- Amount per share: 5 per share<BR>- Ex-date: 22 Nov 24<BR><BR>Dividend Yield: 1.15%.<BR><BR>Total Returns by Period:<BR>In the last 6 months, the price return was -16.29%, with a dividend return of 0%, resulting in a total return of -16.29%.<BR><BR>Over the past year, the price return was -1.42%, the dividend return was 1.11%, leading to a total return of -0.31%.<BR><BR>In the 2-year period, the price return was 45.65%, the dividend return was 1.62%, culminating in a total return of 47.27%.<BR><BR>For the 3-year period, the price return was 75.79%, the dividend return was 2.16%, resulting in a total return of 77.95%.<BR><BR>In the last 4 years, the price return was 27.43%, the dividend return was 1.40%, leading to a total return of 28.83%.<BR><BR>Over the past 5 years, the price return was 64.51%, the dividend return was 1.86%, culminating in a total return of 66.37%.<BR><BR>Overall, FDC Ltd has declared a significant dividend, and while recent returns show some volatility, the longer-term performance indicates positive growth, particularly over the 2 to 5-year periods.

View full answer
iScoreScore
Click here to find our call on this stock
Strong Sell
Sell
Hold
Buy
Strong Buy

Dashboard

1

Poor long term growth as Operating profit has grown by an annual rate -2.21% of over the last 5 years

 
2

Falling Participation by Institutional Investors

3

Below par performance in long term as well as near term

stock-summaryMojo Parameters

Mojo Parameters

Loading Valuation Snapshot...

Stock DNA

stock-summary
Industry

Pharmaceuticals & Biotechnology

stock-summary
Market cap

INR 5,710 Cr (Small Cap)

stock-summary
P/E

19.00

stock-summary
Industry P/E

37

stock-summary
Dividend Yield

1.42%

stock-summary
Debt Equity

-0.20

stock-summary
Return on Equity

11.98%

stock-summary
Price to Book

2.31

Revenue and Profits:
Net Sales:
668 Cr
(Quarterly Results - Jun 2026)
Net Profit:
132 Cr
stock-summaryTotal Returns
Total Returns (Price + Dividend) stock-summary
Dividend Yield (1.42%)
TimePeriod
Price Return
Dividend Return
Total Return
3 Months
-8.05%
0%
-8.05%
6 Months
4.69%
0%
4.69%
1 Year
-25.65%
1.05%
-24.6%
2 Years
-39.59%
1.85%
-37.74%
3 Years
-4.09%
2.61%
-1.48%
4 Years
29.0%
3.61%
32.61%
5 Years
-3.0%
2.83%
-0.17%

Latest dividend: 5 per share ex-dividend date: Feb-11-2026

Risk Adjusted Returns v/s stock-summary
Returns Beta
Icon
Beta has not been calculated since enough price history is not available
stock-summaryNews & Corporate Actions

News

FDC Ltd Declines 0.53% Amid Bearish Technical Signals and Market Underperformance

Announcements stock-summary

Typographical Error In The Notice Of 86Th Annual General Meeting.

17-Sep-2026 | Source : BSE

This is to inform you that a typographical error has occurred in the notice of the 86th AGM for FY 2025-26.

Announcement under Regulation 30 (LODR)-Newspaper Publication

04-Sep-2026 | Source : BSE

Newspaper Publication of the convening of the 86th Annual General Meeting of the Company.

Disclosures under Reg. 29(2) of SEBI (SAST) Regulations 2011

03-Sep-2026 | Source : BSE

The Exchange has received the disclosure under Regulation 29(2) of SEBI (Substantial Acquisition of Shares & Takeovers) Regulations 2011 for Nandan Mohan Chandavarkar

Corporate Actions stock-summary

stock-summary
BOARD MEETING

No Upcoming Board Meetings

stock-summary
DIVIDEND

FDC Ltd has declared 500% dividend, ex-date: 11 Feb 26

stock-summary
SPLITS

No Splits history available

stock-summary
BONUS

No Bonus history available

stock-summary
RIGHTS

No Rights history available

stock-summaryKey Factors

Quality key factors stock-summary

Factor
Value
Sales Growth (5y)
8.26%
EBIT Growth (5y)
-2.21%
EBIT to Interest (avg)
61.66
Debt to EBITDA (avg)
Net Debt is too low
Net Debt to Equity (avg)
-0.20
Sales to Capital Employed (avg)
0.86
Tax Ratio
24.89%
Dividend Payout Ratio
30.51%
Pledged Shares
0
Institutional Holding
7.71%
ROCE (avg)
16.60%
ROE (avg)
11.81%

Valuation key factors

Factor
Value
P/E Ratio
19
Industry P/E
37
Price to Book Value
2.31
EV to EBIT
18.98
EV to EBITDA
15.62
EV to Capital Employed
2.65
EV to Sales
2.39
PEG Ratio
1.26
Dividend Yield
1.42%
ROCE (Latest)
13.83%
ROE (Latest)
11.98%

Technicals key factors

Indicator
Weekly
Monthly
MACD
Bearish
Bearish
RSI
No Signal
No Signal
Bollinger Bands
Mildly Bearish
Mildly Bearish
Moving Averages
Bearish (Daily)
KST
Bearish
Bearish
Dow Theory
Mildly Bullish
Mildly Bearish
OBV
Mildly Bullish
Mildly Bearish
stock-summary Technical Indicator Scale: Bearish, Mildly Bearish, Sideways, Mildly Bullish, Bullish  Turned 
stock-summaryShareholding
Shareholding Snapshot : Jun 2026stock-summary
Shareholding Compare (%holding) stock-summary
Majority shareholders

Promoters

Pledged Promoter Holdings

None

Mutual Funds

Held by 5 Schemes (6.25%)

FIIs

Held by 74 FIIs (1.4%)

Promoter with highest holding

Nomita R Chandavarkar (22.67%)

Highest Public shareholder

Icici Prudential Smallcap Fund (2.8%)

Individual Investors Holdings

17.64%

stock-summaryFinancial
[
  {
    "link": "quarterly",
    "btn_text": "All Quarterly Results",
    "header": "Quarterly Results Snapshot (Consolidated) - Jun'26 - QoQ",
    "rhs": [
      {
        "prefix": "Net Sales ",
        "suffix": "QoQ Growth in quarter ended Jun 2026 is 14.18% vs 25.84% in Mar 2026",
        "dir": -1
      },
      {
        "prefix": "Consolidated Net Profit ",
        "suffix": "QoQ Growth in quarter ended Jun 2026 is 28.13% vs 265.37% in Mar 2026",
        "dir": -1
      }
    ],
    "table": {
      "header": [
        "Jun'26",
        "Mar'26",
        "Change(%)"
      ],
      "body": [
        {
          "field": "Net Sales",
          "val1": "667.69",
          "val2": "584.79",
          "chgp": "14.18%",
          "chgp_class": "positive"
        },
        {
          "field": "Operating Profit (PBDIT) excl Other Income",
          "val1": "143.00",
          "val2": "106.37",
          "chgp": "34.44%",
          "chgp_class": "positive"
        },
        {
          "field": "Interest",
          "val1": "0.83",
          "val2": "1.55",
          "chgp": "-46.45%",
          "chgp_class": "positive"
        },
        {
          "field": "Exceptional Items",
          "val1": "0.00",
          "val2": "0.00",
          "chgp": "",
          "chgp_class": "neutral"
        },
        {
          "field": "Consolidate Net Profit",
          "val1": "132.49",
          "val2": "103.40",
          "chgp": "28.13%",
          "chgp_class": "positive"
        },
        {
          "field": "Operating Profit Margin (Excl OI)",
          "val1": "21.42%",
          "val2": "18.19%",
          "chgp": "3.23%",
          "chgp_class": "positive"
        }
      ]
    }
  },
  {
    "link": "half-yearly",
    "btn_text": "All Half Yearly Results",
    "header": "Half Yearly Results Snapshot (Consolidated) - Sep'25",
    "rhs": [
      {
        "prefix": "Net Sales ",
        "suffix": " Growth in half year ended Sep 2025 is -2.66% vs 12.65% in Sep 2024",
        "dir": -1
      },
      {
        "prefix": "Consolidated Net Profit ",
        "suffix": " Growth in half year ended Sep 2025 is -21.65% vs 6.33% in Sep 2024",
        "dir": -1
      }
    ],
    "table": {
      "header": [
        "Sep'25",
        "Sep'24",
        "Change(%)"
      ],
      "body": [
        {
          "field": "Net Sales",
          "val1": "1,121.44",
          "val2": "1,152.12",
          "chgp": "-2.66%",
          "chgp_class": "negative"
        },
        {
          "field": "Operating Profit (PBDIT) excl Other Income",
          "val1": "175.59",
          "val2": "216.79",
          "chgp": "-19.00%",
          "chgp_class": "negative"
        },
        {
          "field": "Interest",
          "val1": "2.32",
          "val2": "2.37",
          "chgp": "-2.11%",
          "chgp_class": "positive"
        },
        {
          "field": "Exceptional Items",
          "val1": "0.00",
          "val2": "0.00",
          "chgp": "",
          "chgp_class": "neutral"
        },
        {
          "field": "Consolidate Net Profit",
          "val1": "149.72",
          "val2": "191.08",
          "chgp": "-21.65%",
          "chgp_class": "negative"
        },
        {
          "field": "Operating Profit Margin (Excl OI)",
          "val1": "15.66%",
          "val2": "18.82%",
          "chgp": "-3.16%",
          "chgp_class": "negative"
        }
      ]
    }
  },
  {
    "link": "nine-monthly",
    "btn_text": "All Nine Monthly Results",
    "header": "Nine Monthly Results Snapshot (Consolidated) - Dec'25",
    "rhs": [
      {
        "prefix": "Net Sales ",
        "suffix": "YoY Growth in nine months ended Dec 2025 is -1.86% vs 9.14% in Dec 2024",
        "dir": -1
      },
      {
        "prefix": "Consolidated Net Profit ",
        "suffix": "YoY Growth in nine months ended Dec 2025 is -21.96% vs -11.90% in Dec 2024",
        "dir": -1
      }
    ],
    "table": {
      "header": [
        "Dec'25",
        "Dec'24",
        "Change(%)"
      ],
      "body": [
        {
          "field": "Net Sales",
          "val1": "1,586.15",
          "val2": "1,616.23",
          "chgp": "-1.86%",
          "chgp_class": "negative"
        },
        {
          "field": "Operating Profit (PBDIT) excl Other Income",
          "val1": "227.87",
          "val2": "263.44",
          "chgp": "-13.50%",
          "chgp_class": "negative"
        },
        {
          "field": "Interest",
          "val1": "3.44",
          "val2": "3.32",
          "chgp": "3.61%",
          "chgp_class": "negative"
        },
        {
          "field": "Exceptional Items",
          "val1": "-20.79",
          "val2": "0.00",
          "chgp": "",
          "chgp_class": "neutral"
        },
        {
          "field": "Consolidate Net Profit",
          "val1": "178.02",
          "val2": "228.12",
          "chgp": "-21.96%",
          "chgp_class": "negative"
        },
        {
          "field": "Operating Profit Margin (Excl OI)",
          "val1": "14.37%",
          "val2": "16.30%",
          "chgp": "-1.93%",
          "chgp_class": "negative"
        }
      ]
    }
  },
  {
    "link": "annual",
    "btn_text": "All Annual Results",
    "header": "Annual Results Snapshot (Consolidated) - Mar'26",
    "rhs": [
      {
        "prefix": "Net Sales ",
        "suffix": "YoY Growth in year ended Mar 2026 is 2.98% vs 8.50% in Mar 2025",
        "dir": -1
      },
      {
        "prefix": "Consolidated Net Profit ",
        "suffix": "YoY Growth in year ended Mar 2026 is 5.48% vs -12.59% in Mar 2025",
        "dir": 1
      }
    ],
    "table": {
      "header": [
        "Mar'26",
        "Mar'25",
        "Change(%)"
      ],
      "body": [
        {
          "field": "Net Sales",
          "val1": "2,170.93",
          "val2": "2,108.12",
          "chgp": "2.98%",
          "chgp_class": "positive"
        },
        {
          "field": "Operating Profit (PBDIT) excl Other Income",
          "val1": "346.10",
          "val2": "324.80",
          "chgp": "6.56%",
          "chgp_class": "positive"
        },
        {
          "field": "Interest",
          "val1": "4.99",
          "val2": "4.51",
          "chgp": "10.64%",
          "chgp_class": "negative"
        },
        {
          "field": "Exceptional Items",
          "val1": "-20.79",
          "val2": "0.00",
          "chgp": "",
          "chgp_class": "neutral"
        },
        {
          "field": "Consolidate Net Profit",
          "val1": "281.42",
          "val2": "266.79",
          "chgp": "5.48%",
          "chgp_class": "positive"
        },
        {
          "field": "Operating Profit Margin (Excl OI)",
          "val1": "15.94%",
          "val2": "15.41%",
          "chgp": "0.53%",
          "chgp_class": "positive"
        }
      ]
    }
  }
]

Quarterly Results Snapshot (Consolidated) - Jun'26 - QoQstock-summary

Jun'26
Mar'26
Change(%)
Net Sales
667.69
584.79
14.18%
Operating Profit (PBDIT) excl Other Income
143.00
106.37
34.44%
Interest
0.83
1.55
-46.45%
Exceptional Items
0.00
0.00
Consolidate Net Profit
132.49
103.40
28.13%
Operating Profit Margin (Excl OI)
21.42%
18.19%
3.23%
Values in Rs Cr.
Direction Arrows
Net Sales

QoQ Growth in quarter ended Jun 2026 is 14.18% vs 25.84% in Mar 2026

Direction Arrows
Consolidated Net Profit

QoQ Growth in quarter ended Jun 2026 is 28.13% vs 265.37% in Mar 2026

Half Yearly Results Snapshot (Consolidated) - Sep'25stock-summary

Sep'25
Sep'24
Change(%)
Net Sales
1,121.44
1,152.12
-2.66%
Operating Profit (PBDIT) excl Other Income
175.59
216.79
-19.00%
Interest
2.32
2.37
-2.11%
Exceptional Items
0.00
0.00
Consolidate Net Profit
149.72
191.08
-21.65%
Operating Profit Margin (Excl OI)
15.66%
18.82%
-3.16%
Values in Rs Cr.
Direction Arrows
Net Sales

Growth in half year ended Sep 2025 is -2.66% vs 12.65% in Sep 2024

Direction Arrows
Consolidated Net Profit

Growth in half year ended Sep 2025 is -21.65% vs 6.33% in Sep 2024

Nine Monthly Results Snapshot (Consolidated) - Dec'25stock-summary

Dec'25
Dec'24
Change(%)
Net Sales
1,586.15
1,616.23
-1.86%
Operating Profit (PBDIT) excl Other Income
227.87
263.44
-13.50%
Interest
3.44
3.32
3.61%
Exceptional Items
-20.79
0.00
Consolidate Net Profit
178.02
228.12
-21.96%
Operating Profit Margin (Excl OI)
14.37%
16.30%
-1.93%
Values in Rs Cr.
Direction Arrows
Net Sales

YoY Growth in nine months ended Dec 2025 is -1.86% vs 9.14% in Dec 2024

Direction Arrows
Consolidated Net Profit

YoY Growth in nine months ended Dec 2025 is -21.96% vs -11.90% in Dec 2024

Annual Results Snapshot (Consolidated) - Mar'26stock-summary

Mar'26
Mar'25
Change(%)
Net Sales
2,170.93
2,108.12
2.98%
Operating Profit (PBDIT) excl Other Income
346.10
324.80
6.56%
Interest
4.99
4.51
10.64%
Exceptional Items
-20.79
0.00
Consolidate Net Profit
281.42
266.79
5.48%
Operating Profit Margin (Excl OI)
15.94%
15.41%
0.53%
Values in Rs Cr.
Direction Arrows
Net Sales

YoY Growth in year ended Mar 2026 is 2.98% vs 8.50% in Mar 2025

Direction Arrows
Consolidated Net Profit

YoY Growth in year ended Mar 2026 is 5.48% vs -12.59% in Mar 2025

stock-summaryCompany CV
About FDC Ltd stock-summary
stock-summary
FDC Ltd
Small Cap
Pharmaceuticals & Biotechnology
FDC Limited is a fully integrated, research-oriented pharmaceutical company engaged in the manufacturing and marketing of Formulations (Finished Dosage Forms) and Active Pharmaceutical Ingredients (APIs). The Company is a prominent player in the Indian pharmaceutical industry, renowned for its expertise in developing specialised formulations. It leads the market in sectors such as Oral Rehydration Solutions (ORS), energy drinks, antibiotics and ophthalmic therapies.
Company Coordinates stock-summary
Company Details
B-8 MIDC Industrial Area, Waluj Dist Aurangabad (Maharashtra) Maharashtra : 431136
stock-summary
Tel: 91-240-2554407/967/299
stock-summary
investors@fdcindia.com
Registrar Details
Sharex Dynamic (India) Pvt Ltd , Unit -1, Luthra Ind. Premises , Safed Pool, Andheri-Kurla Road, Andheri (E), Mumbai